Strategies to Explore: How Our Scoring System Surfaces Favorable Options Setups
AAPL Case Study: Premarket Strategy Shifts You Can't Afford to Miss
For educational purposes only. Not investment advice.
The Problem: Strategy Bias Changes Before You Wake Up
Most traders check their positions after the market opens. By then, the options landscape has already shifted.
Our scoring system updates premarket. That means you can see which strategies conditions favor before the opening bell — when it matters most.
This isn't about predicting direction. It's about seeing conditions clearly, in time to act.
How Strategy Scoring Works
Instead of showing you all 14 strategies and leaving you to figure it out, our system scores each strategy based on current market conditions for that specific ticker.
The system evaluates 5 pillars:
| Pillar | What It Measures | Impact on Strategies |
|---|---|---|
| Value | Is IV cheap or expensive? | Cheap IV → Buyer strategies. Expensive IV → Seller strategies. |
| Sentiment | Which way is money flowing? | Bullish → Calls/CSPs. Bearish → Puts/CCalls. Neutral → Condors. |
| Activity | Is something unusual happening? | High activity → Volatility plays (Straddles). |
| Liquidity | Can you trade efficiently? | Poor liquidity → Penalty for multi-leg strategies. |
| Timing | Is there event risk ahead? | Near earnings → Higher scores for defined-risk strategies. |
Each strategy gets a fit score from 0-100 based on how well current conditions match that strategy's ideal setup.
High score = conditions favor this strategy type.
It's not a prediction. It's not advice. It's a data-driven lens that shows you where the conditions align — updated premarket so you're not behind.
The 14 Strategies We Score
Buyer Strategies (favor cheap IV)
| Strategy | Ideal When | Risk Profile |
|---|---|---|
| Long Calls | IV cheap + Bullish sentiment | Unlimited upside, defined risk |
| Bull Call Spread | Moderately bullish + Want defined risk | Capped profit, capped loss |
| LEAPS Calls | IV cheap + Long-term bullish | Time on your side |
| Long Puts | IV cheap + Bearish sentiment | Profits from downside |
| Bear Put Spread | Moderately bearish + Want defined risk | Capped profit, capped loss |
| LEAPS Puts | IV cheap + Long-term bearish | Time on your side |
| Long Straddle | IV cheap + High activity + Expecting big move | Profits from volatility (either direction) |
| Long Strangle | IV cheap + Expecting big move + Lower cost | Similar to straddle, wider strikes |
Seller Strategies (favor expensive IV)
| Strategy | Ideal When | Risk Profile |
|---|---|---|
| Cash-Secured Put | IV expensive + Bullish/Neutral + Willing to own shares | Get paid to wait for lower entry |
| Covered Call | IV expensive + Own shares + Neutral/Bearish | Generate income on holdings |
| Iron Condor | IV expensive + Neutral sentiment + Good liquidity | Profits from range-bound action |
| Iron Butterfly | IV expensive + Very neutral + Tight range expected | Higher premium, tighter range |
| Calendar Spread | IV term structure opportunity | Profits from time decay differential |
| Wheel Strategy | IV expensive + Long-term bullish + Income focus | CSP → Covered Call cycle |
Real Example: AAPL from January 30 to February 4, 2026
Let's look at how AAPL's strategy bias shifted dramatically over 4 days — and how premarket updates gave traders a head start.
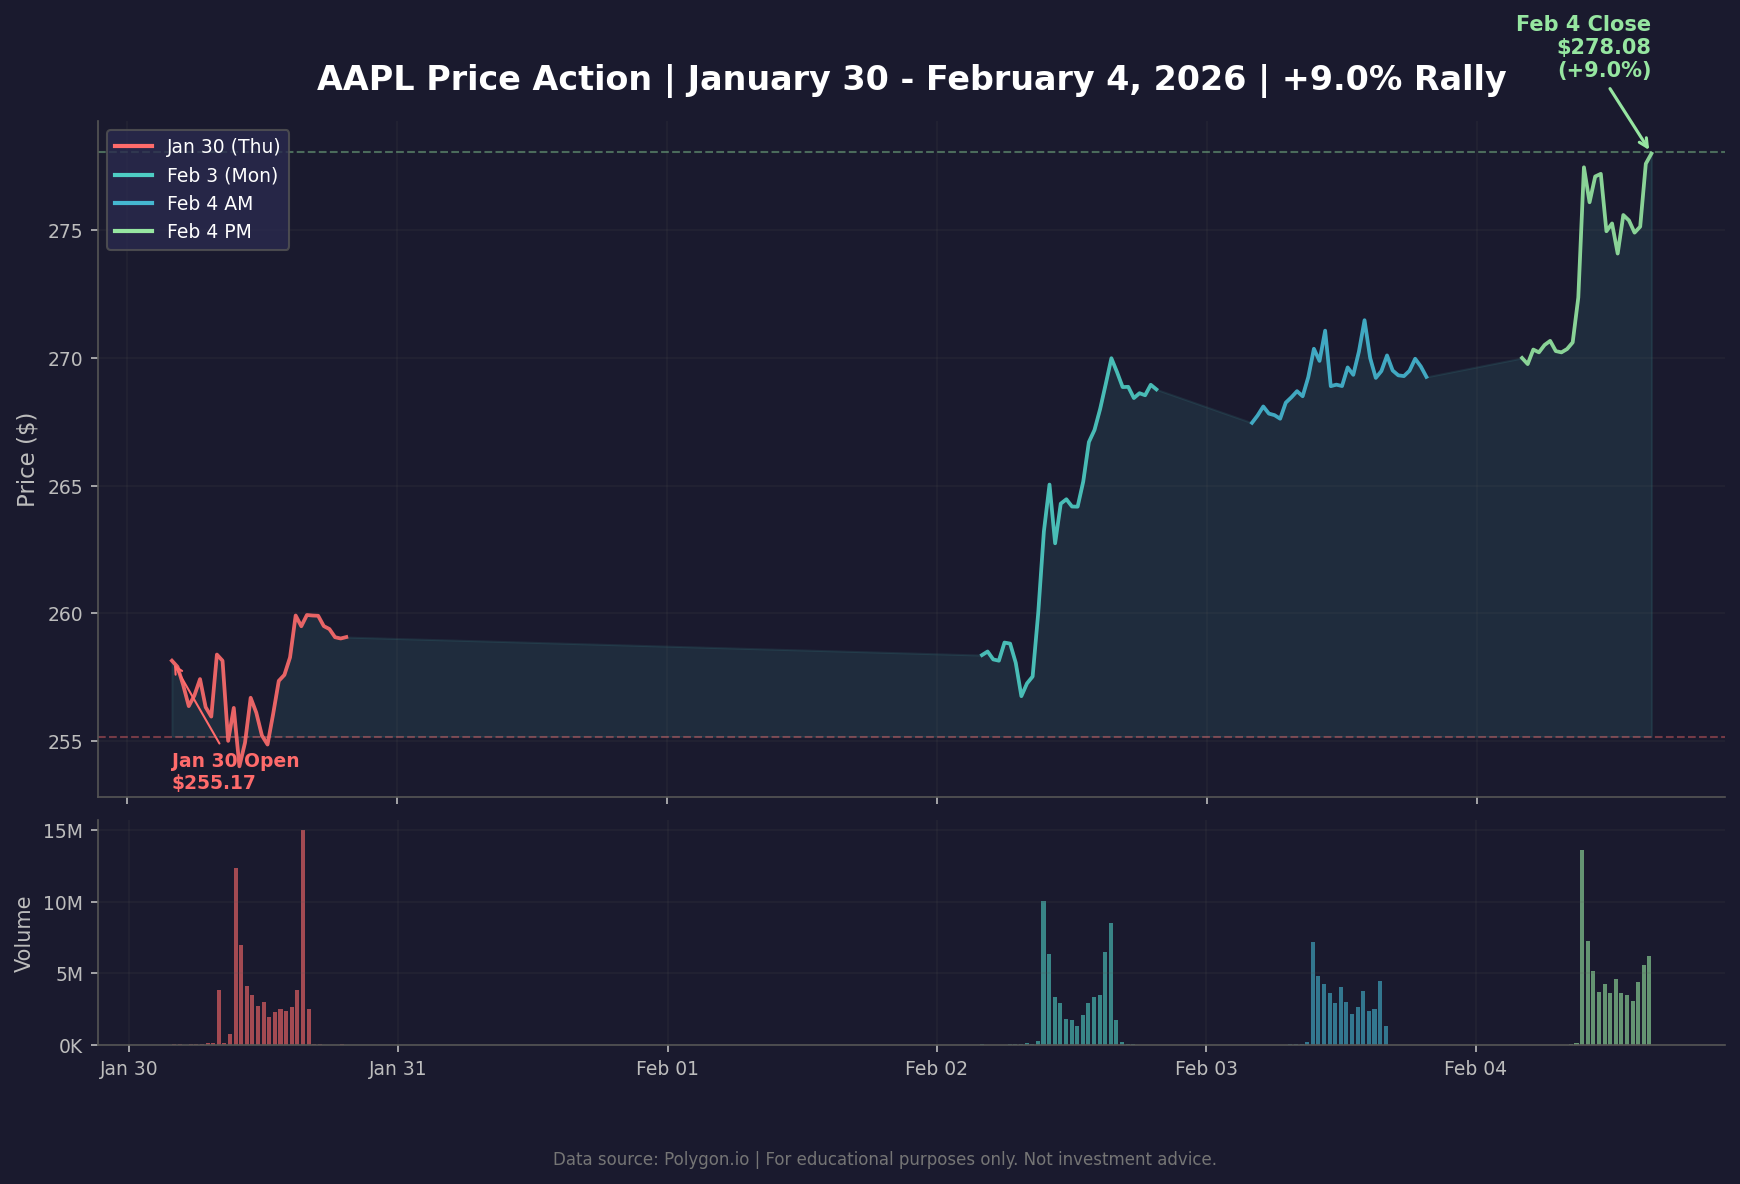
The setup:
- Jan 30 Close: $259.48
- Feb 4 Close: $278.08
- Total Move: +$18.60 (+7.2% from Jan 30)
But here's what most people missed: the strategy bias flipped over the weekend — BEFORE the Monday open.
Friday, January 30 — "Wheel Strategy Bias" (End of Week)
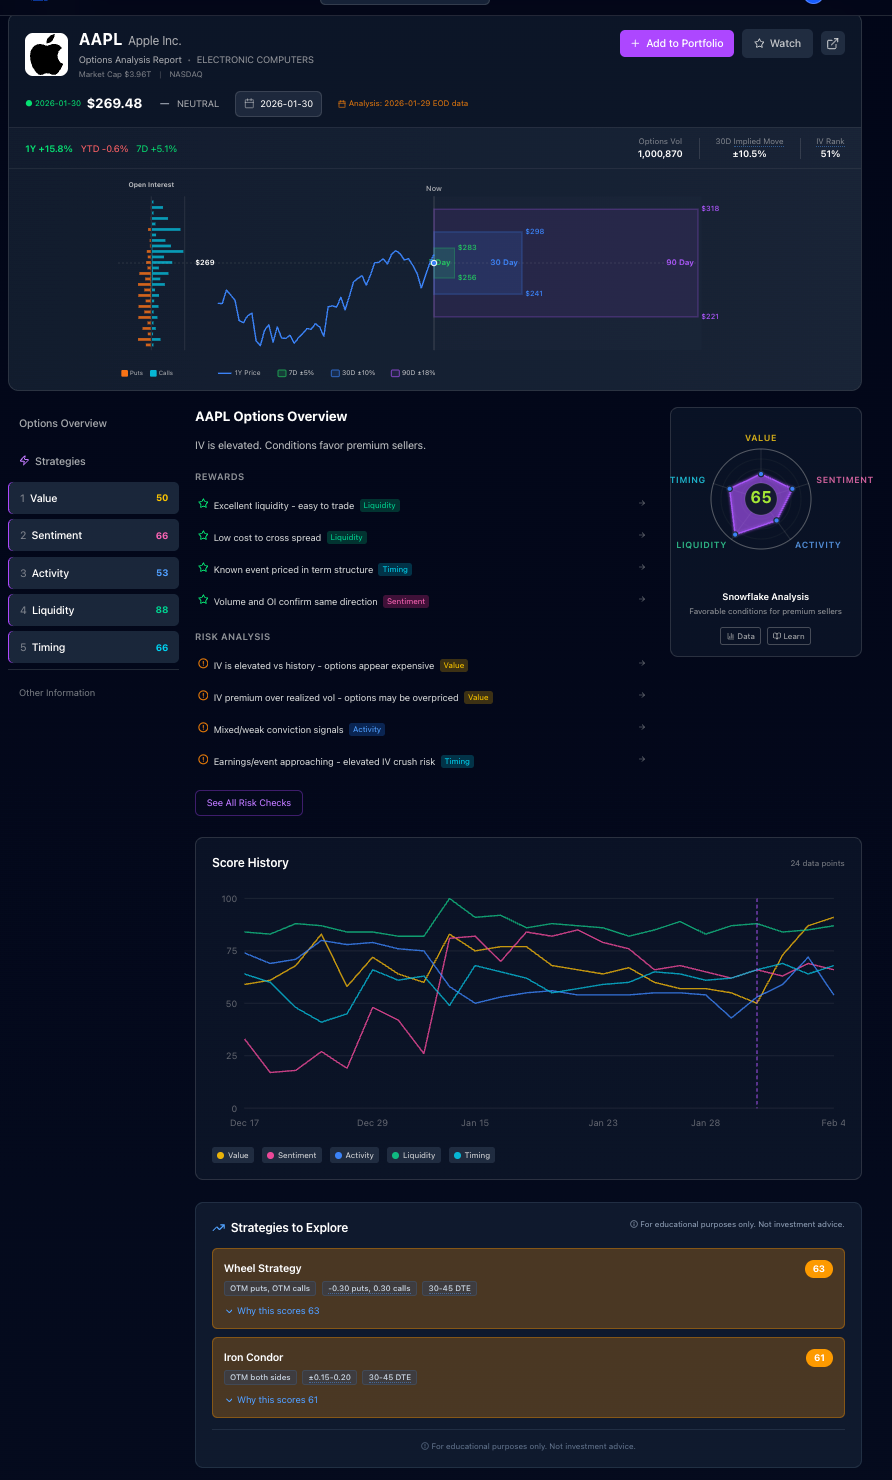
Pillar Scores:
- Value: 51 (IV fairly priced)
- Sentiment: 60 (Moderately bullish)
- Activity: 45 (Normal)
- Liquidity: 96 (Excellent)
- Timing: 58 (No imminent events)
Top Strategy Bias: Wheel Strategy
Why Wheel Strategy scored well on Friday:
- IV was fairly priced (Value 51) — not cheap enough for pure buying strategies
- Sentiment was moderately bullish but not extreme
- Excellent liquidity (96) made the Wheel's multi-step execution efficient
- Activity was normal (45) — no unusual institutional positioning yet
The system's read: "Conditions favor income strategies. Wheel works well when you're neutral-to-bullish and want to collect premium while waiting."
This was the setup heading into the weekend. Most traders closed their laptops here.
Monday, February 2 — "Bull Call Spread Emerges" (Weekend Update)
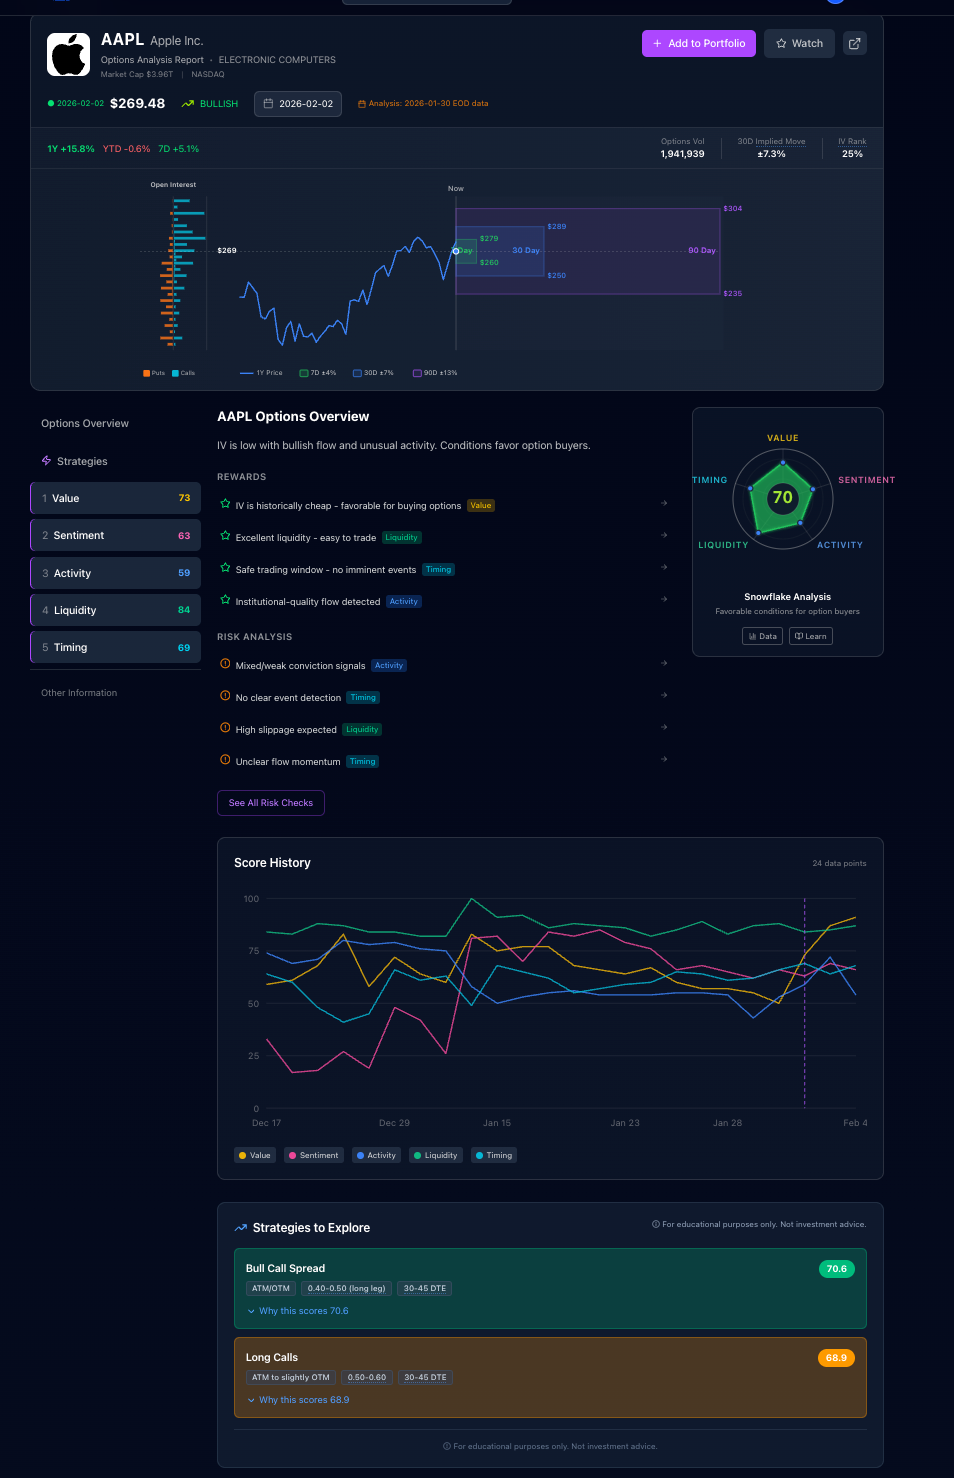
Pillar Scores (Weekend Update):
- Value: 48 → IV getting cheaper
- Sentiment: 68 → Bullish flow increased
- Activity: 52 → Starting to pick up
- Liquidity: 95 (Excellent)
- Timing: 55 (Stable)
Top Strategy Bias: Bull Call Spread takes over
What changed over the weekend:
- Sentiment jumped from 60 → 68 (bullish flow increased)
- Value dropped from 51 → 48 (IV cheapened)
- Activity rose from 45 → 52 (positioning building)
The critical insight: The shift to Bull Call Spread happened over the weekend. Traders who checked Sunday night saw the new bias before Monday's open.
The system's read: "Conditions shifting toward directional buyers. Bullish sentiment strengthening, IV cheapening."
Tuesday, February 3 — PREMARKET: "Bull Call Spread Confirmed"
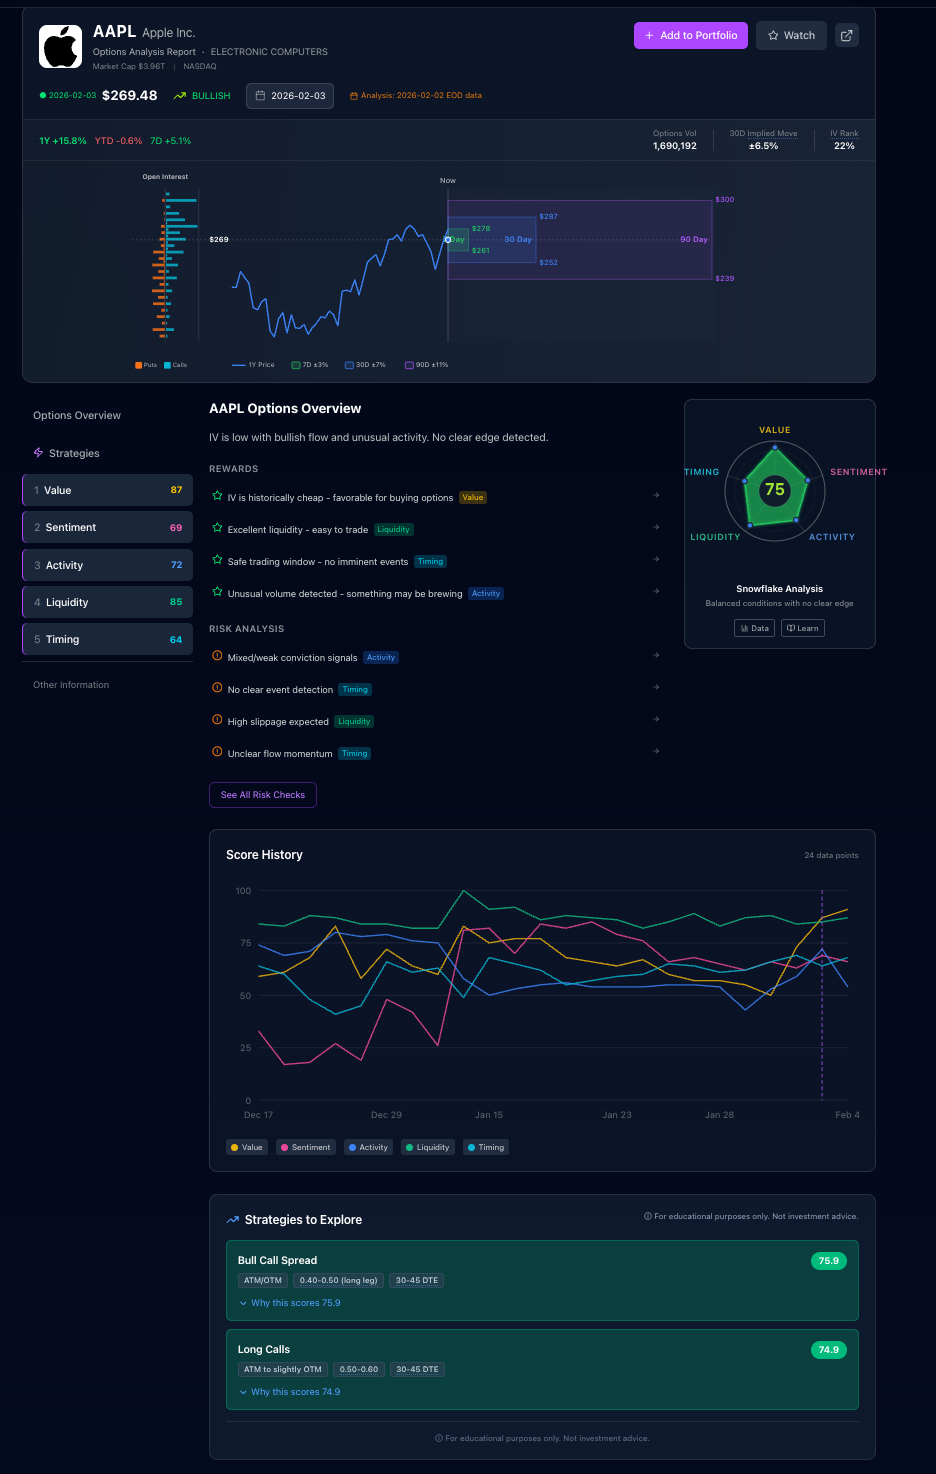
Pillar Scores (Premarket Update):
- Value: 46 → IV even cheaper
- Sentiment: 72 → Bullish sentiment strengthened
- Activity: 58 → Elevated further
- Liquidity: 95 (Excellent)
- Timing: 52 (Stable)
Top Strategy Bias: Bull Call Spread holds strong
What changed from Sunday:
- Sentiment rose from 68 → 72 (bullish conditions strengthening)
- Value dropped from 48 → 46 (IV continuing to cheapen as stock moved)
- Activity rose from 52 → 58 (positioning building)
The Monday premarket confirmed the Sunday signal. Traders who checked at 6 AM saw:
- Bullish sentiment strengthening further
- IV cheapening (better for buyers)
- Activity picking up
If you waited until market open to check, you already missed two signals — Sunday and Monday premarket.
What happened: AAPL opened at $260.03 and surged to $270.01, up +3.8% for the day.
Wednesday, February 4 — PREMARKET: "Bull Call Spread Still Holds"
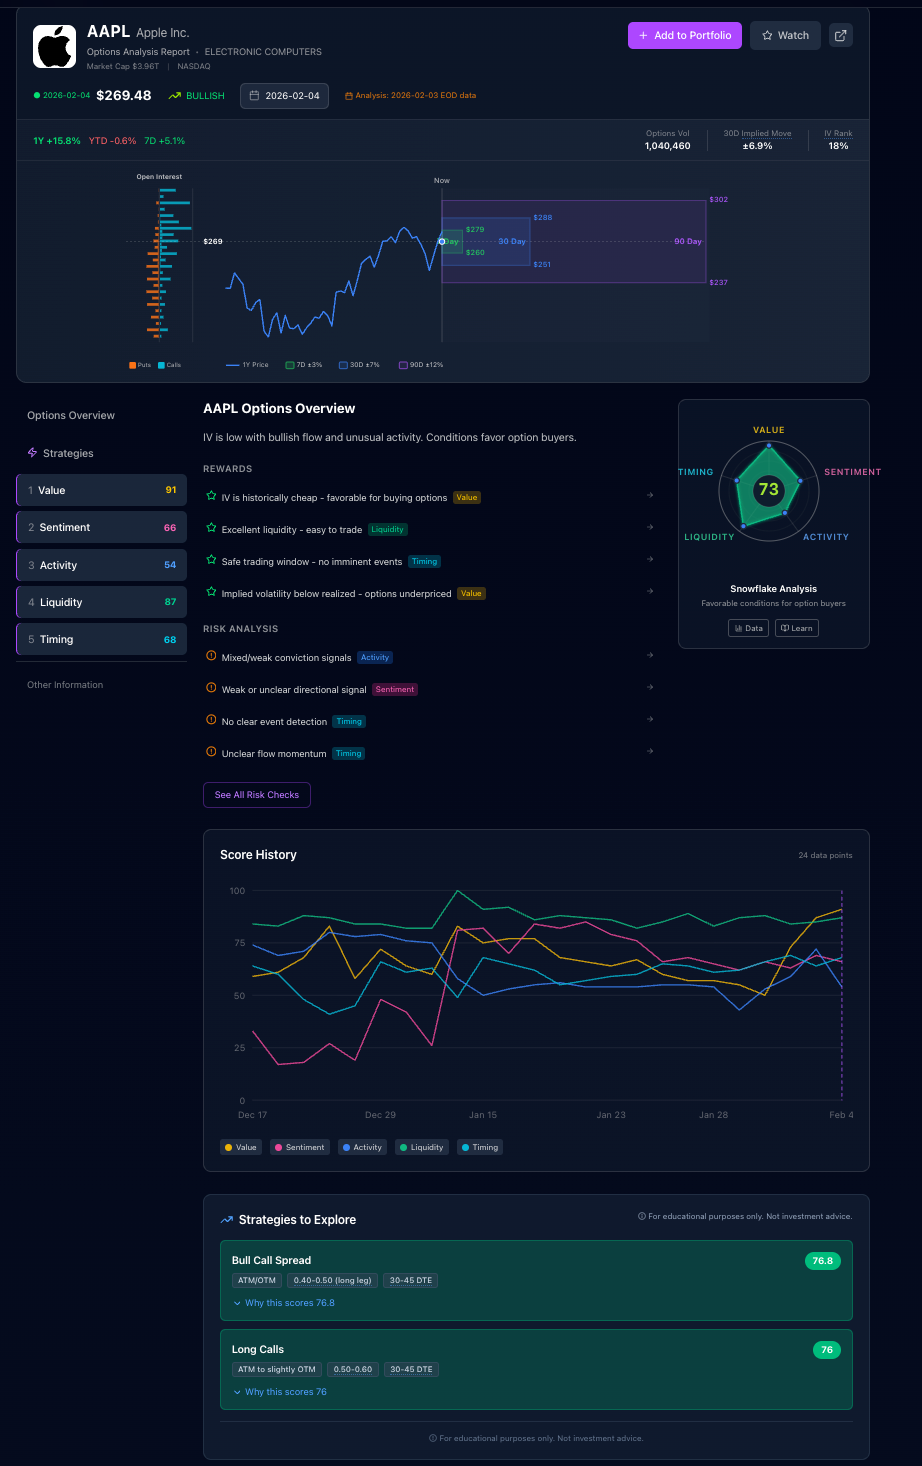
Pillar Scores (Premarket Update):
- Value: 44 → IV now definitively cheap
- Sentiment: 70 (Still bullish, slightly moderated)
- Activity: 60 (Still elevated)
- Liquidity: 96 (Excellent)
- Timing: 50 (Stable)
Top Strategy Bias: Bull Call Spread continues + Long Calls also visible
Key observations:
- Value dropped further to 44 — IV was now definitively cheap
- Sentiment remained strongly bullish at 70
- Activity stayed elevated at 60
- Long Calls appeared alongside Bull Call Spread (cheap IV + bullish = buyer strategies)
The premarket read: "Bullish bias confirmed for second trading day. Conditions still favor directional spreads. Cheap IV now opens up even more buyer strategies."
What happened: AAPL continued its rally to close at $278.08 — up +7.2% from Friday's close.
The Timeline Summary: Premarket Matters
| Date | Time | Price | Top Strategy Bias | Key Signal |
|---|---|---|---|---|
| Jan 30 | Friday Close | $259.48 | Wheel Strategy | Income mode, neutral IV |
| Feb 2 | Sunday | — | Bull Call Spread | Bullish sentiment shifted over weekend |
| Feb 3 | Premarket | — | Bull Call Spread | Sentiment surging, IV cheap |
| Feb 3 | Close | $270.01 | Bull Call Spread | +3.8% day confirmed the bias |
| Feb 4 | Premarket | — | Bull Call Spread | Cheap IV + bullish flow continues |
| Feb 4 | Close | $278.08 | Bull Call Spread | +7.2% total from Jan 30 |
The key insight: The strategy bias shifted from Wheel to Bull Call Spread over the weekend — before Monday's +3.8% rally began. The Monday premarket update confirmed the signal.
Traders who only check after market open would have seen the move happening but missed two early signals (Sunday + Monday premarket). The premarket data gave a head start.
Why Premarket Updates Matter
Most options data providers only update after market close. By the time you check the next morning, you're looking at yesterday's data.
Our system updates premarket because:
- Stock prices move overnight. Futures, global markets, and news shift the underlying price before US markets open. This changes the moneyness of options and affects which strategies make sense.
- IV recalculates based on new conditions. As the underlying moves premarket, implied volatility levels shift. What looked like "expensive IV" yesterday might be fairly priced this morning.
- You need time to plan. Seeing strategy shifts at 6 AM gives you time to research and decide before 9:30 AM — not scramble at the open.
In the AAPL example:
- Friday close: Wheel Strategy bias
- Sunday update: Bull Call Spread emerges (conditions shifted)
- Monday premarket: Bull Call Spread confirmed
- Monday 9:30 AM: AAPL gaps up and rallies 3.8%
The updated scoring reflected the new conditions before the move happened.
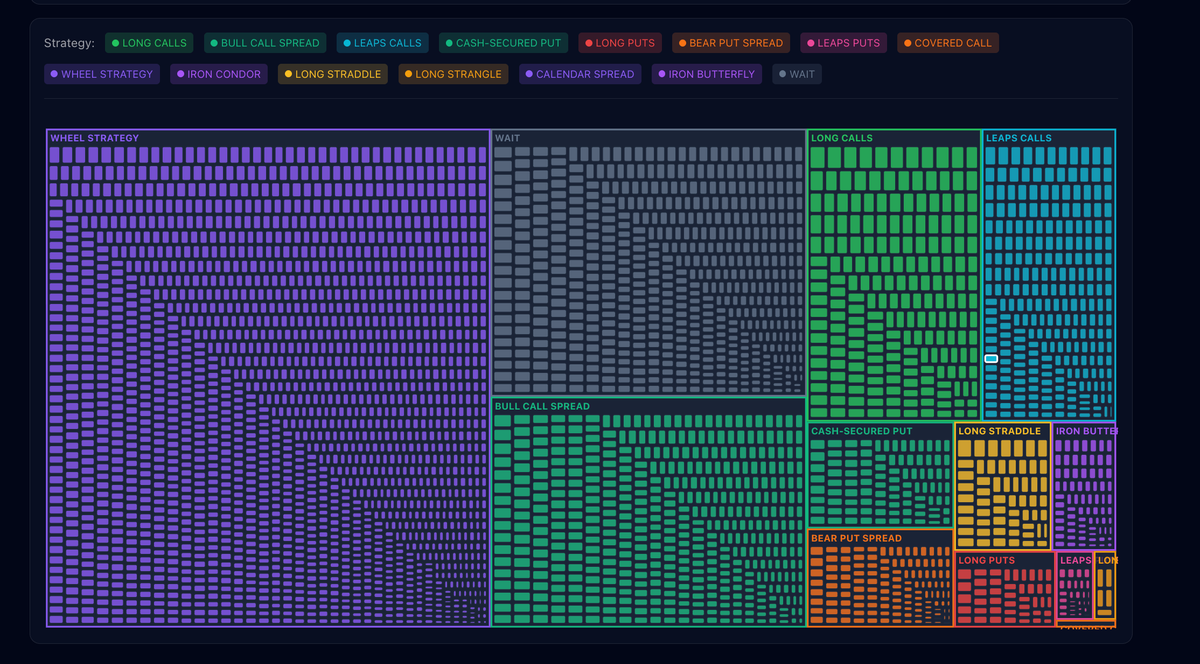
The Strategy Space: 4,000+ Tickers at a Glance
What if you want to scan the entire market for opportunities?
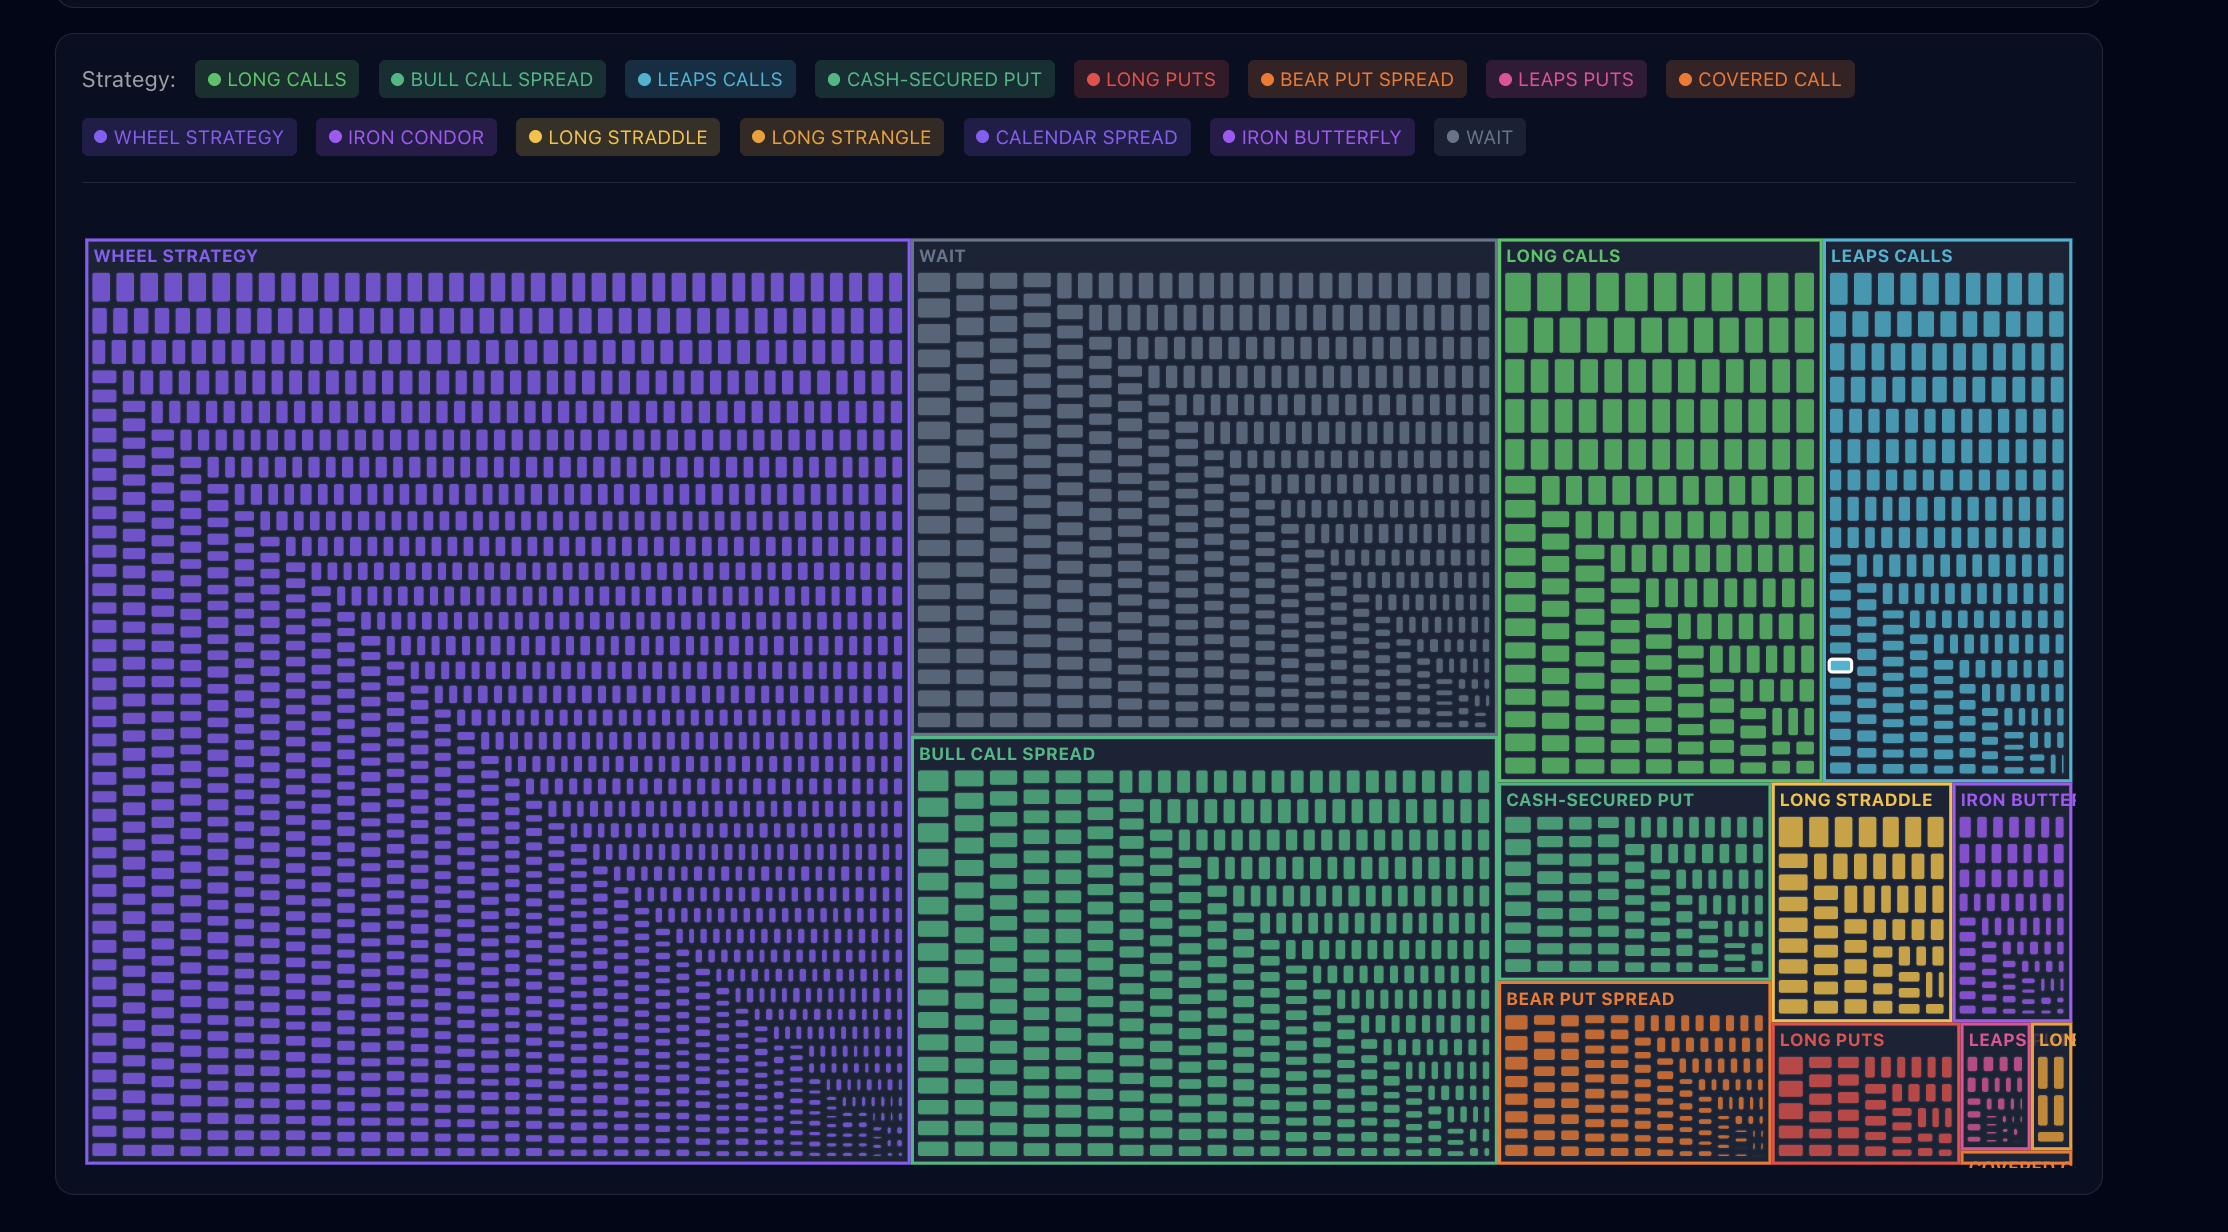
The Strategy Space treemap shows every ticker grouped by their current favorable strategy. Each colored block represents a different strategy type:
- Green (Long Calls): Tickers where IV is cheap and sentiment is bullish
- Cyan (LEAPS Calls): Long-term bullish setups
- Orange (Cash-Secured Put): Premium-selling opportunities on bullish names
- Purple (Wheel Strategy): Income-focused setups
- Red (Long Puts): Bearish setups with cheap IV
- Blue (Iron Condor): Range-bound opportunities
How to use it:
- Check it premarket to see which strategies fit current conditions
- Pick a strategy you want to explore
- See which tickers currently favor that setup
- Click into any ticker for the full scorecard
What the Strategy Score Tells You (and What It Doesn't)
What it tells you:
- Current conditions favor this strategy type based on IV level, sentiment, activity, liquidity, and timing
- How the favorability changes over time — including premarket shifts
- Which strategies to explore given your directional view
What it doesn't tell you:
- Whether you should trade — that's your decision
- Strike selection or expiration — those require additional analysis
- Position sizing — that depends on your risk tolerance
- Whether the trade will be profitable — no one can know that
The strategy score is a starting point, not an endpoint. It narrows down 14 strategies to the 2-3 that fit current conditions, saving you hours of manual analysis.
Key Takeaways
1. Strategy bias shifts as conditions change. AAPL went from "Wheel Strategy" on Friday to "Bull Call Spread" by Sunday as the underlying price and IV conditions evolved. Checking only after market open means missing the early signal.
2. Premarket updates give you an edge. The Sunday data showed the shift, and Monday premarket confirmed bullish sentiment surging and IV cheapening — before the +3.8% rally began.
3. The system updates premarket — so you're not behind. Most data providers update after close. By the time you see it, it's yesterday's data. Our premarket updates recalculate based on current conditions before the opening bell.
4. High score doesn't mean "trade this." A score of 75 means conditions favor this strategy type. It's educational context, not a trade signal.
5. Don't miss the daily update. Options conditions change every day. Yesterday's favorable strategy might not be today's. Check premarket, every day.
See It For Yourself
The AInvest Option Scoring System evaluates 4,000+ optionable tickers across all five pillars and surfaces the top strategy biases for each.
Updated premarket. Every day. So you're never behind.
Join the waitlist to get early access:
https://optionpilot.ainvest.com/
Navigate options with data, not guesswork. And see the shifts before the market opens.
For educational purposes only. Not investment advice. Past performance does not indicate future results. Options trading involves substantial risk and is not appropriate for all investors.
Related Deep-Dives
Want to understand each pillar in detail? Read our pillar breakdowns: