Pillar Deep-Dive #4: LIQUIDITY — "Can I Trade This Efficiently?"
Today we're diving into the LIQUIDITY pillar — the fourth of our five pillars that power Options Pilot. A great trade idea means nothing if you can't execute it efficiently. Wide spreads and thin order books can turn winners into losers before you even start.
Subject Line: UNP has an 11.5% bid-ask spread. Here's what that costs you.
The Hidden Tax Nobody Talks About
You found a great setup. The VALUE is there. The SENTIMENT is bullish.
You buy calls. The stock moves in your favor.
But when you try to exit... you realize you're down 15% even though the stock went up.
What happened?
You traded an illiquid option. The bid-ask spread ate your profit.
This is the hidden tax that destroys retail traders — and most platforms don't even show you the data to avoid it.
Why Liquidity Matters More Than You Think
The bid-ask spread is the price you pay to enter AND exit a trade.
Let's do the math on UNP:
- ATM Spread: 11.51%
- You buy at the ask, sell at the bid
- Round-trip cost: ~11.51% just in spread
- Add slippage for larger orders: another 5-10%
That means you need UNP to move 15-20% just to break even.
This is why professionals obsess over liquidity. It's not glamorous. But it's the difference between making money and donating it to market makers.
The 4 Components of Options Liquidity
Most traders only look at volume. That's a mistake.
Real liquidity comes from four factors:
1. Bid-Ask Spread
The tighter the spread, the less you lose on entry/exit.
| Spread | Quality | Impact |
|---|---|---|
| <1% | Excellent | Minimal cost |
| 1-2% | Good | Acceptable |
| 2-5% | Moderate | Use limit orders |
| 5-10% | Poor | Significant drag |
| >10% | Very Poor | Avoid or size down |
UNP: 11.51% — Very wide. Difficult execution.
2. Open Interest (OI)
More open contracts = more counterparties = easier fills.
| OI | Quality |
|---|---|
| >1M | Excellent |
| 100K-1M | Good |
| 10K-100K | Moderate |
| <10K | Thin |
UNP: 93K — Adequate, but not deep.
3. Daily Volume
Higher volume = more activity = better price discovery.
| Volume | Quality |
|---|---|
| >500K | Excellent |
| 100K-500K | Good |
| 10K-100K | Moderate |
| <10K | Thin |
UNP: 6.1K — Low daily activity.
4. Order Book Depth
How many contracts sit at the bid/ask? Thin books mean slippage on larger orders.
UNP: 130 bid / 101 ask — Adequate for small orders, problematic for size.
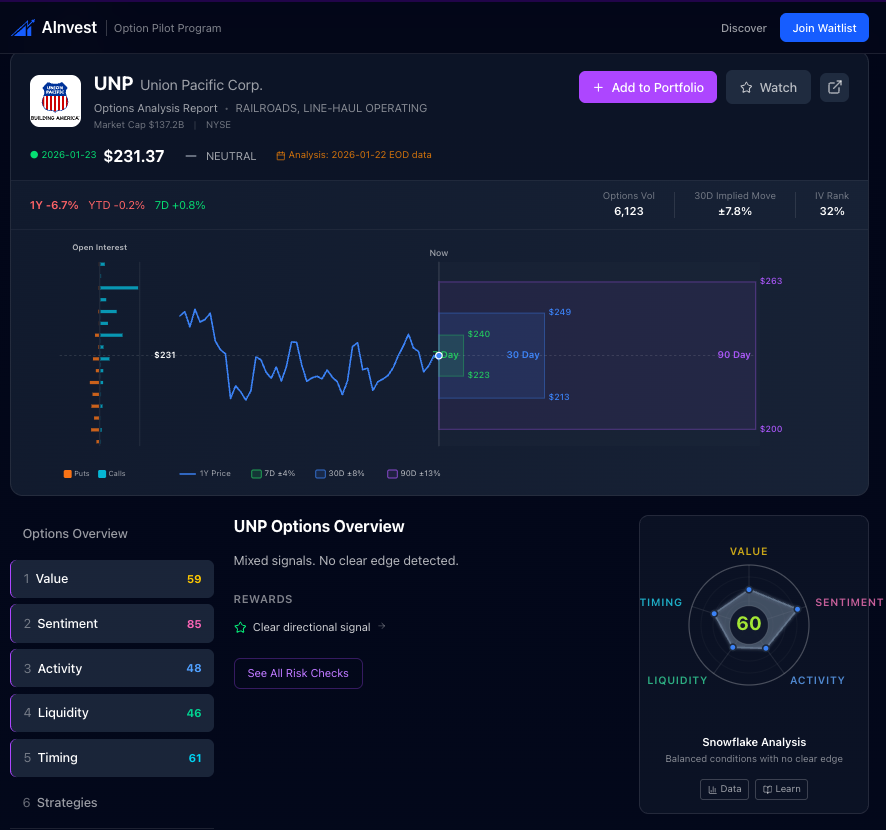
Real Example: UNP Today
Let's look at Union Pacific (UNP) using Options Pilot:
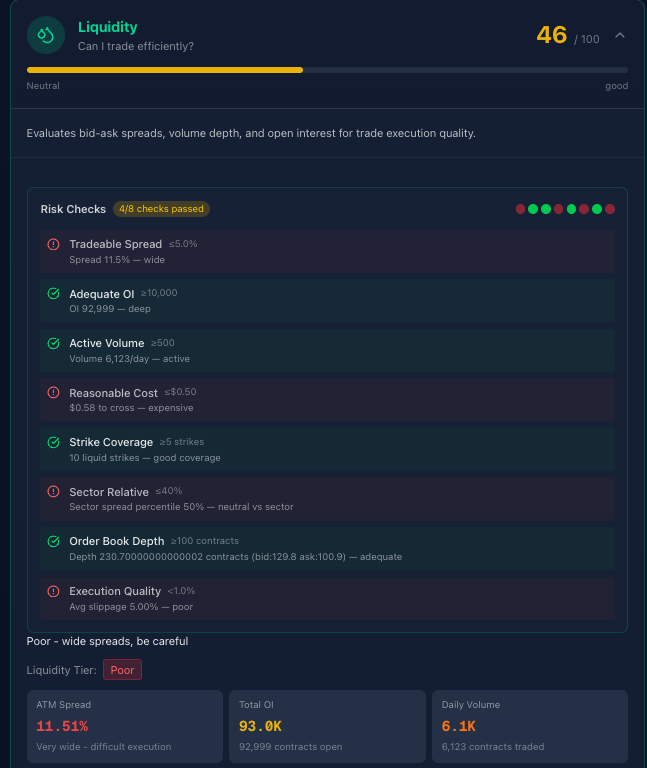
LIQUIDITY Score: 46/100 — Poor. Wide spreads, be careful.
Here's what the 8 Risk Checks tell us:
| Check | Threshold | UNP | Status |
|---|---|---|---|
| Tradeable Spread | ≤5.0% | 11.5% | ❌ Wide |
| Adequate OI | ≥10,000 | 92,999 | ✅ Deep |
| Active Volume | ≥500/day | 6,123 | ✅ Active |
| Reasonable Cost | ≤$0.50 | $0.58 | ❌ Expensive |
| Strike Coverage | ≥5 strikes | 10 liquid | ✅ Good |
| Sector Relative | ≤40% | 50% | ❌ Neutral vs sector |
| Order Book Depth | ≥100 contracts | 230 | ✅ Adequate |
| Execution Quality | <1.0% | 5.00% | ❌ Poor |
Only 4 of 8 checks passed.
Liquidity Tier: Poor
Translation: UNP has enough open interest and volume to trade, but the wide spreads make execution expensive. Every trade starts at a disadvantage.
The Spread Analysis: Where It Gets Expensive
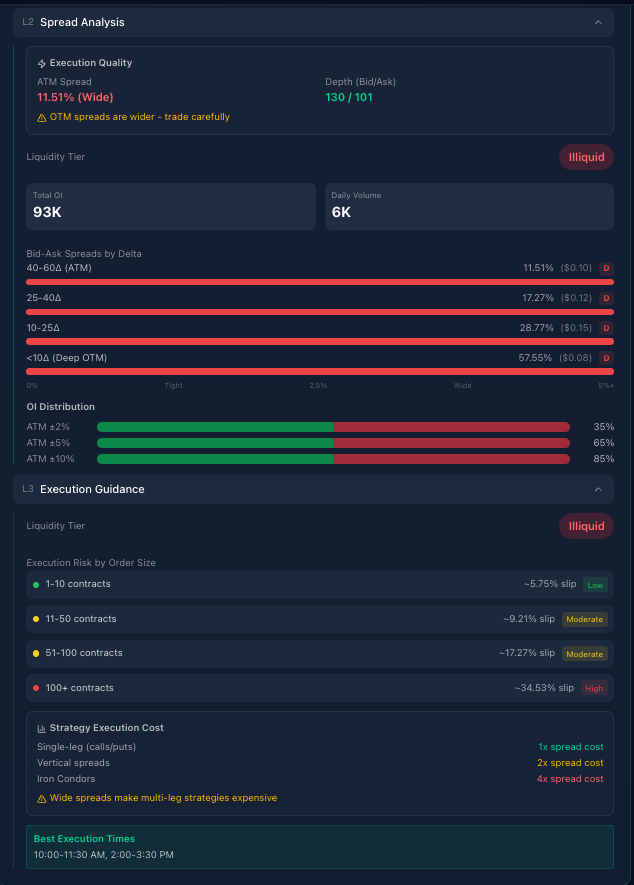
Spreads by Delta (Moneyness)
| Delta Range | Spread | Cost to Cross | Grade |
|---|---|---|---|
| 40-60Δ (ATM) | 11.51% | $0.10 | D |
| 25-40Δ | 17.27% | $0.12 | D |
| 10-25Δ | 28.77% | $0.15 | D |
| <10Δ (Deep OTM) | 57.55% | $0.08 | D |
The insight: Spreads widen dramatically as you move away from ATM. Deep OTM options have 57% spreads — essentially untradeable.
OI Distribution
| Strike Range | % of Chain |
|---|---|
| ATM ±2% | 35% |
| ATM ±5% | 65% |
| ATM ±10% | 85% |
Translation: Most liquidity is concentrated near ATM. Going further out = worse execution.
Execution Guidance: The Real Cost
Slippage by Order Size
| Order Size | Est. Slippage | Execution Risk |
|---|---|---|
| 1-10 contracts | ~5.75% | Low |
| 11-50 contracts | ~9.21% | Moderate |
| 51-100 contracts | ~17.27% | Moderate |
| 100+ contracts | ~34.53% | High |
The math is brutal: If you try to trade 100 contracts, expect 17-35% slippage on top of the spread.
Strategy Execution Cost
| Strategy | Legs | Spread Cost |
|---|---|---|
| Single-leg (calls/puts) | 1 | 1x spread |
| Vertical spreads | 2 | 2x spread |
| Iron Condors | 4 | 4x spread |
Warning: Wide spreads make multi-leg strategies expensive.
With UNP's 11.51% ATM spread:
- Vertical spread: ~23% round-trip cost
- Iron Condor: ~46% round-trip cost
At that cost, the strategy needs to be nearly perfect to profit.
Best Execution Times
Trade during: 10:00-11:30 AM, 2:00-3:30 PM
Avoid: First 15 minutes, Last 15 minutes (widest spreads, most volatile)
The Strategy Recommendation: WAIT
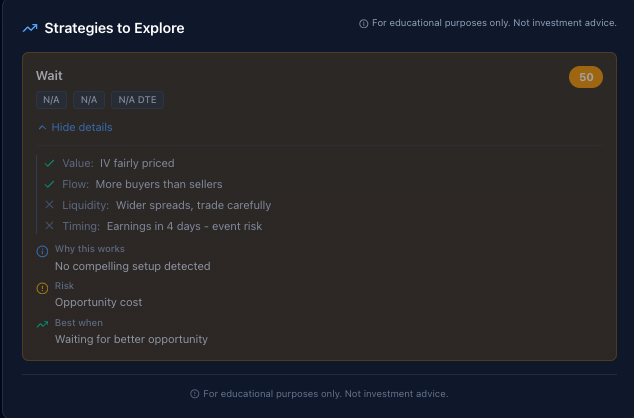
Strategy: Wait (Score: 50)
Why:
- ✅ Value: IV fairly priced
- ✅ Flow: More buyers than sellers
- ❌ Liquidity: Wider spreads, trade carefully
- ❌ Timing: Earnings in 4 days — event risk
"No compelling setup detected"
The liquidity warning is critical: Even if the setup looks good on other metrics, the wide spreads make efficient execution difficult.
The Simple Framework
Here's how to use LIQUIDITY in your trading:
| LIQUIDITY Score | Spread Quality | What To Do |
|---|---|---|
| 80-100 | Excellent (<1%) | Trade freely, market orders OK |
| 60-79 | Good (1-2%) | Normal trading, limit orders preferred |
| 40-59 | Moderate (2-5%) | Use limit orders, be patient |
| 20-39 | Poor (5-10%) | Size down, wide limits, or avoid |
| 0-19 | Illiquid (>10%) | Experienced traders only |
UNP at 46? Poor liquidity. If you must trade, use limit orders and expect slippage. Better yet, find a more liquid alternative.
Why Poor Liquidity = Poor Trades
Here's what happens when you ignore liquidity:
Scenario: You're right on direction, wrong on execution
- You buy UNP calls at $2.00 (the ask)
- The stock moves 3% in your favor
- Your calls are now worth $2.20 theoretically
- But the bid is only $1.90 (11.5% spread)
- You sell at $1.90
- Result: -5% loss despite being right
This happens every day to traders who don't check liquidity first.
What Good Liquidity Looks Like
For comparison, here's what a LIQUIDITY score of 80+ looks like:
- ATM Spread: <1% (not 11.5%)
- Daily Volume: 100K+ (not 6K)
- OI: 500K+ (not 93K)
- Slippage: <1% for 100 contracts (not 17%)
Stocks like AAPL, SPY, QQQ, NVDA have this kind of liquidity. UNP doesn't.
The Liquidity Checklist
Before every options trade, ask:
- What's the ATM spread? (>5% = caution, >10% = avoid)
- What's the daily volume? (<10K = thin)
- What's the OI? (<10K = limited counterparties)
- How does slippage scale? (Check execution guidance)
- Is my strategy multi-leg? (Multiply spread cost by legs)
If liquidity fails these checks, either:
- Find a more liquid alternative
- Size down significantly
- Use very wide limit orders and be patient
- Skip the trade entirely
Get the Full Picture
LIQUIDITY is one of five pillars we analyze:
- VALUE — Are options cheap or expensive?
- SENTIMENT — What are traders betting?
- ACTIVITY — Is something unusual happening?
- LIQUIDITY — Can you trade efficiently? ← You are here
- TIMING — Is now the right moment?
We score 4,000+ stocks across all five pillars. Every trading day.
Stop Donating to Market Makers
Every wide spread is a transfer from your account to theirs.
If you want:
- ATM spread data before you trade
- Slippage estimates by order size
- Execution guidance and best trading windows
- Clear warnings when liquidity is poor
Join the Options Score waitlist: