Pillar Deep-Dive #3: ACTIVITY — "Is Something Happening That Others Don't See?"
Today we're diving into the ACTIVITY pillar — the third of our five pillars that power Options Scoring system. While everyone watches stock price, the options market often moves first. We show you where the option activity is positioning.
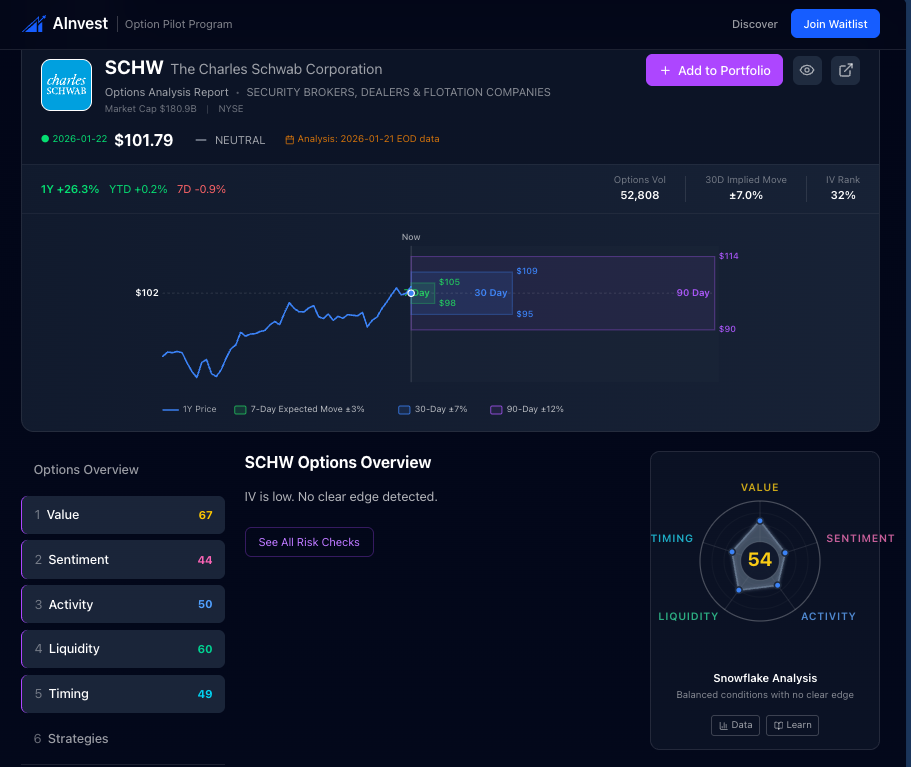
The SCHW Story: What Our Data Showed Before Earnings
Charles Schwab (SCHW) reported earnings this morning.
But here's the thing: our data was from yesterday's close.
And it already showed something interesting happening in the options market:
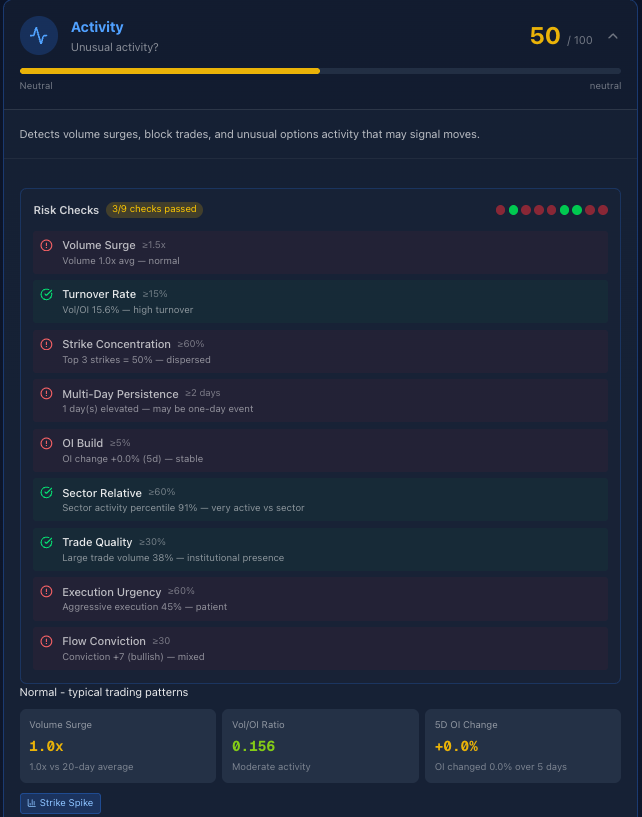
ACTIVITY Score: 50/100 — Neutral
Wait, only 50? That doesn't sound exciting.
But look deeper at the 9 risk checks we run:
| Check | Threshold | SCHW | Status |
|---|---|---|---|
| Volume Surge | ≥1.5x | 1.0x | Normal |
| Turnover Rate | ≥15% | 15.6% | ✅ High |
| Strike Concentration | ≥60% | 50% | Dispersed |
| Multi-Day Persistence | ≥2 days | 1 day | One-day |
| OI Build | ≥5% | +0.0% | Stable |
| Sector Relative | ≥60% | 91% | ✅ Very active vs sector |
| Trade Quality | ≥30% | 38% | ✅ Institutional presence |
| Execution Urgency | ≥60% | 45% | Patient |
| Flow Conviction | ≥30 | +7 | Mixed |
3 of 9 checks passed. The score is 50 (neutral).
But here's what most traders miss: The sector relative percentile was 91% — meaning SCHW had more unusual activity than 91% of its financial sector peers.
And the trade quality? 38% large trade volume — institutional presence detected.
The Problem: You Can't See What's Happening
Most traders watch volume. "Volume is up 20%!" they say.
But volume alone is like watching car traffic without knowing where anyone is going.
Here's what volume doesn't tell you:
1. Is this normal for THIS stock?
- AAPL trading 2M contracts? Normal.
- SCHW trading 53K contracts? Is that high or low? You have no idea.
- Context matters more than raw numbers.
2. Is this sustainable or a one-day spike?
- Volume spike on news = reactive (too late)
- Volume building over 2-3 days = positioning (actionable)
- Persistence separates signal from noise.
3. Are positions being opened or closed?
- High volume + rising OI = new positions being built
- High volume + flat OI = day traders churning
- High volume + falling OI = positions being closed
- Same volume, completely different meaning.
4. Who's trading?
- 100 trades of 10 contracts = retail
- 1 trade of 1,000 contracts = institutional
- Size tells you who's at the table.
Our Solution: The ACTIVITY Score
We combine 9 different checks into one score that answers: "Is something unusual happening that's worth paying attention to?"
ACTIVITY answers: "Are traders positioning in ways that suggest they know something?"
- High score (70+) = Unusual activity detected — investigate
- Mid score (40-60) = Normal trading patterns — no edge
- Low score (<40) = Below average activity — quiet period
The 9 Risk Checks Explained
Here's what we actually measure:
1. Volume Surge (≥1.5x)
Is today's volume elevated vs the 20-day average?
- SCHW: 1.0x — normal
- When this is 2x+, something is happening
2. Turnover Rate (≥15%)
Volume / Open Interest ratio. How actively are positions being traded?
- SCHW: 15.6% — ✅ high turnover
- High turnover = active positioning
3. Strike Concentration (≥60%)
Is volume focused on specific strikes or spread across many?
- SCHW: 50% across top 3 strikes — dispersed
- High concentration = targeted institutional order
4. Multi-Day Persistence (≥2 days)
Has elevated activity persisted multiple days?
- SCHW: 1 day — may be one-day event
- Multi-day buildup = conviction
5. OI Build (≥5%)
Is open interest increasing (new positions) or decreasing (closing)?
- SCHW: +0.0% — stable
- Rising OI = new money entering
6. Sector Relative (≥60%)
How does this stock's activity compare to its sector peers?
- SCHW: 91st percentile — ✅ very active vs sector
- This is the hidden signal — SCHW stood out vs other financials
7. Trade Quality (≥30%)
What percentage of volume came from large trades (100+ contracts)?
- SCHW: 38% — ✅ institutional presence
- High quality = professional money
8. Execution Urgency (≥60%)
Were trades executed aggressively (crossing the spread)?
- SCHW: 45% — patient
- High urgency = someone in a hurry
9. Flow Conviction (≥30)
Combined directional signal from all flow analysis
- SCHW: +7 (bullish) — mixed
- High conviction = clear directional bet
The Unusual Option Flow: Where's The Money?
This is where it gets interesting:
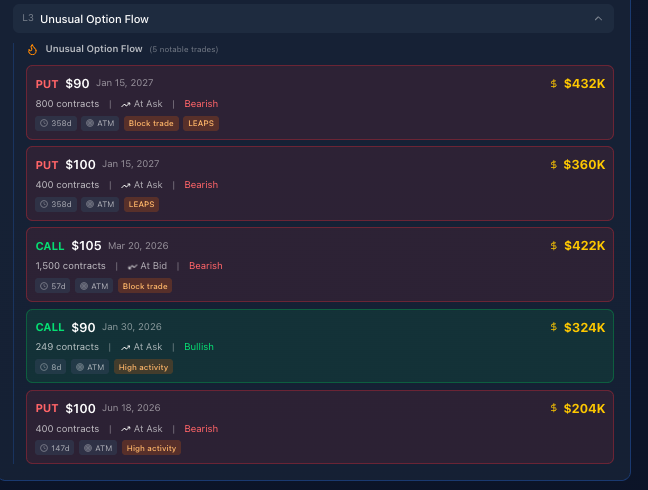
5 notable trades detected:
| Type | Strike | Expiry | Size | Premium | Signal |
|---|---|---|---|---|---|
| PUT | $90 | Jan 15, 2027 | 800 | $432K | Bearish |
| PUT | $100 | Jan 15, 2027 | 400 | $360K | Bearish |
| CALL | $105 | Mar 20, 2026 | 1,500 | $422K | Bearish* |
| CALL | $90 | Jan 30, 2026 | 249 | $324K | Bullish |
| PUT | $100 | Jun 18, 2026 | 400 | $204K | Bearish |
*The $105 Call was bought at bid — that's actually a bearish signal (someone sold to close).
Total premium in unusual trades: $1.74M
The insight: Even though the overall score was "neutral," there was $1.74M in institutional-sized LEAPS trades — positions being built for 2027.
This is the kind of positioning you don't see on a stock chart.
The Volume Breakdown: Context Is Everything
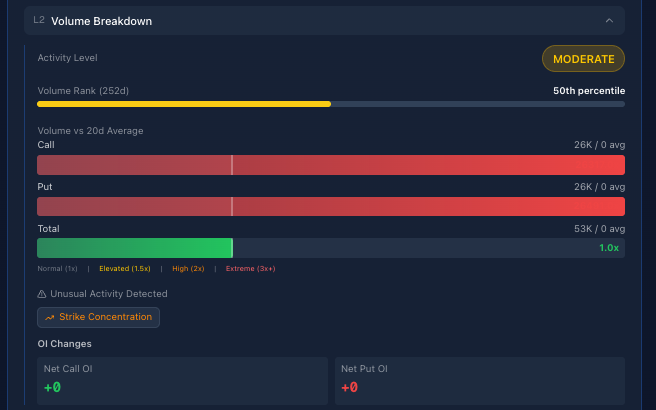
| Metric | Value | What It Means |
|---|---|---|
| Activity Level | MODERATE | 50th percentile vs 252-day history |
| Volume vs 20d Avg | 1.0x | Normal volume day |
| Call Volume | 26K vs 0 avg | Active |
| Put Volume | 26K vs 0 avg | Active |
| Total Volume | 53K | 1.0x average |
Unusual Activity Detected: Strike Concentration
OI Changes:
- Net Call OI: +0
- Net Put OI: +0
Translation: Volume was balanced (26K calls, 26K puts), but the strike concentration flagged unusual positioning at specific strikes.
What Strategies Made Sense?
Based on the activity data, here's what our product leans into:
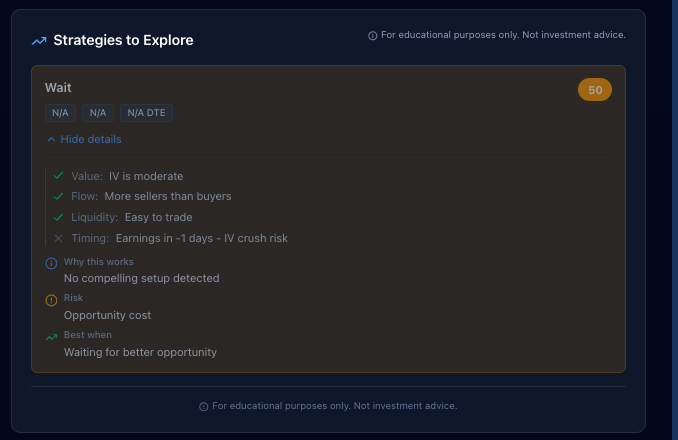
Strategy: WAIT (Score: 50)
Why wait?
- ✅ Value: IV is moderate
- ✅ Flow: More sellers than buyers
- ✅ Liquidity: Easy to trade
- ❌ Timing: Earnings in ~1 day — IV crush risk
"No compelling setup detected"
This is the power of the system. Even though we detected institutional LEAPS activity, the overall setup said: "Don't trade into earnings. Let it play out."
Now, after SCHW beat earnings this morning, the next move becomes clearer.
The Simple Framework
Here's how to use ACTIVITY in your trading:
| ACTIVITY Score | Signal | What To Do |
|---|---|---|
| 80-100 | Extreme activity | Something is happening — investigate immediately |
| 60-79 | Elevated | Above normal — worth watching |
| 40-59 | Normal | Typical patterns — no edge from activity |
| 20-39 | Quiet | Below average — potential calm before storm |
| 0-19 | Dead | Very low activity — avoid options, wide spreads |
SCHW at 50? Normal overall, but the 91st percentile sector rank and $1.74M in LEAPS suggested smart money was positioning ahead of earnings.
Why Activity Matters More Than You Think
Here's the insight that changes everything:
Options traders are often right BEFORE the news.
- Earnings beats? Look for unusual call activity in the days before
- Earnings misses? Put activity often spikes beforehand
- M&A? Block trades in LEAPS appear weeks before announcements
The options market is a leading indicator, not a lagging one.
But you need to:
- Filter the noise — separate institutional from retail
- Context matters — compare to sector, not absolutes
- Persistence counts — one-day spikes mean less than multi-day buildups
- Size matters — 38% large trade volume is meaningful, 5% is not
That's exactly what ACTIVITY measures.
Get the Full Picture
ACTIVITY is one of five pillars we analyze:
- VALUE — Are options cheap or expensive?
- SENTIMENT — What direction are traders betting?
- ACTIVITY — Is something unusual happening? ← You are here
- LIQUIDITY — Can you trade efficiently?
- TIMING — Is now the right moment?
We score 4,000+ stocks across all five pillars. Every trading day.
Stop Trading Blind
Volume alone doesn't tell you who's trading, why, or whether it matters.
If you want:
- The full 9-check activity breakdown before you trade
- Unusual option flow detection showing institutional positioning
- Sector-relative context that reveals hidden signals
- Strategy suggestions based on actual positioning data
Join the Options Pilot waitlist:
Get Early Access