# Pillar Deep-Dive #2: SENTIMENT — "What Are Options Traders Actually Betting?"
Today we're diving into the SENTIMENT pillar — the second of our five pillars that power Options Pilot. While most traders rely on a single P/C ratio, we show you the full picture of what options traders are actually betting.
Subject Line: INTC P/C ratio says bullish. But that's only half the story.
The Problem With P/C Ratio
You checked the put/call ratio. It says 0.48 — bullish.
You buy calls. The stock goes sideways. You lose money.
What went wrong?
You relied on a single number to tell you a complex story.
The put/call ratio is the most popular options sentiment indicator. It's also dangerously incomplete.
The 4 Blind Spots of P/C Ratio
1. It doesn't tell you WHERE the volume is
- OTM calls = lottery tickets (retail speculation)
- ITM calls = real money commitment (institutional conviction)
- P/C ratio treats $500 in OTM calls the same as $50,000 in ITM calls
2. It doesn't tell you if volume and open interest agree
- High call volume + LOW call OI = day traders closing positions, no conviction
- High call volume + HIGH call OI = new positions being built, real conviction
- P/C ratio ignores this completely
3. It can't separate smart money from retail noise
- 0DTE volume = mostly retail gambling
- 30-60 DTE volume = planned institutional trades
- A 0.5 P/C ratio from 0DTE lottery tickets means something very different than 0.5 from LEAPS
4. It has no context
- A tech stock with 0.6 P/C might be normal (tech is always call-heavy)
- A utility stock with 0.6 P/C is extremely bullish (utilities are usually put-heavy)
- P/C ratio alone can't tell you what's normal for THIS stock
Our Solution: The SENTIMENT Score
We combine 7 different checks into one score that shows you the full picture of a day's options flow.
Think of it like a doctor's checkup — one blood test isn't enough to know your health. You need multiple measurements that all point in the same direction.
SENTIMENT answers: "How clear is the signal from options traders?"
- High score (70+) = Clear, strong signal — trade with confidence
- Mid score (40-60) = Mixed signals — wait or reduce size
- Low score (<40) = Conflicting data — avoid directional bets
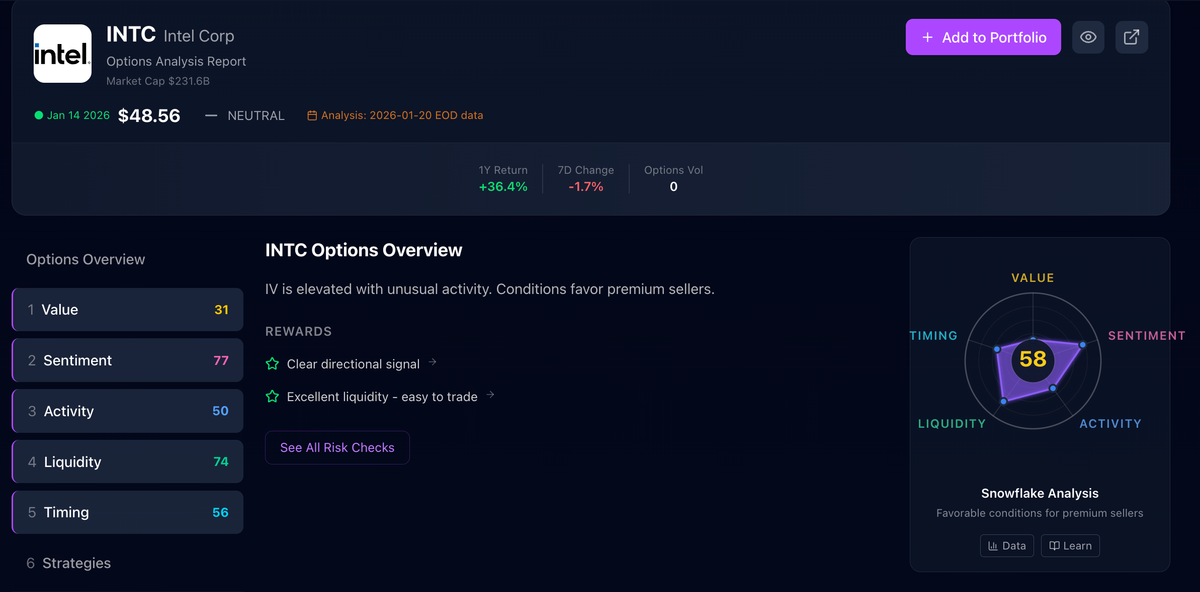
Real Example: INTC Today
Let's look at Intel (INTC) using Options Pilot:
SENTIMENT Score: 77/100 — Good signal clarity
But look deeper. The P/C ratio of 0.48 is just ONE of seven checks we run:
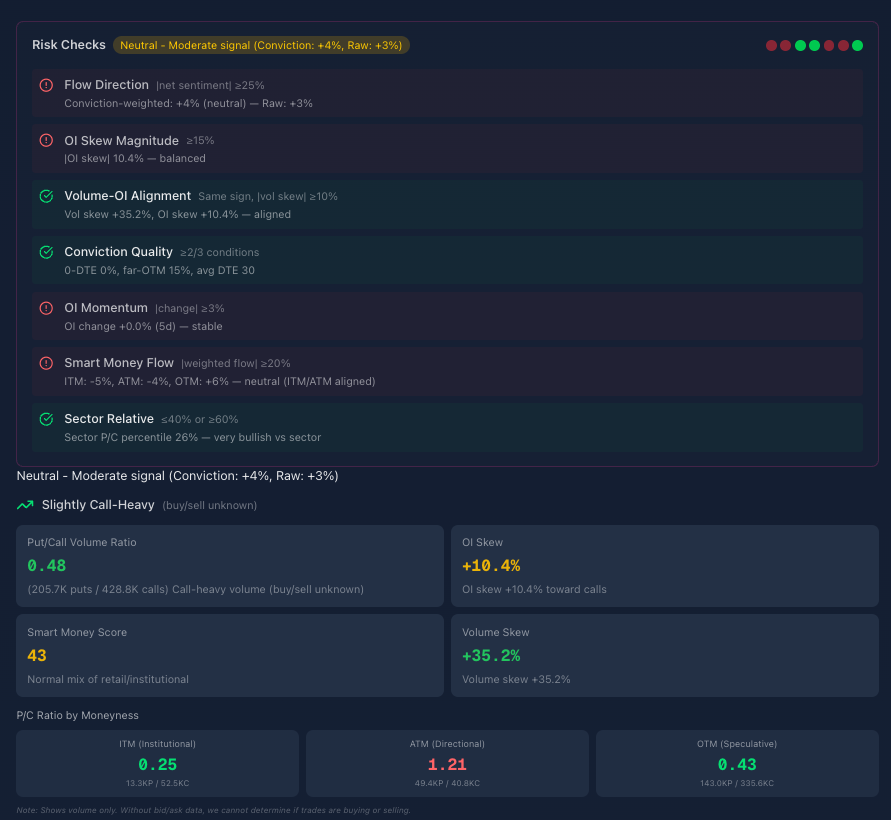
| Metric | Value | What It Means |
|---|---|---|
| P/C Volume Ratio | 0.48 | Call-heavy (2x more calls than puts) |
| OI Skew | +10.4% | Open interest tilted toward calls |
| Volume Skew | +35.2% | Today's volume strongly call-biased |
| Smart Money Score | 43 | Normal mix of retail/institutional |
The P/C ratio alone said "bullish."
Our 7 checks said "bullish, but with moderate conviction."
That's the difference between guessing and knowing.
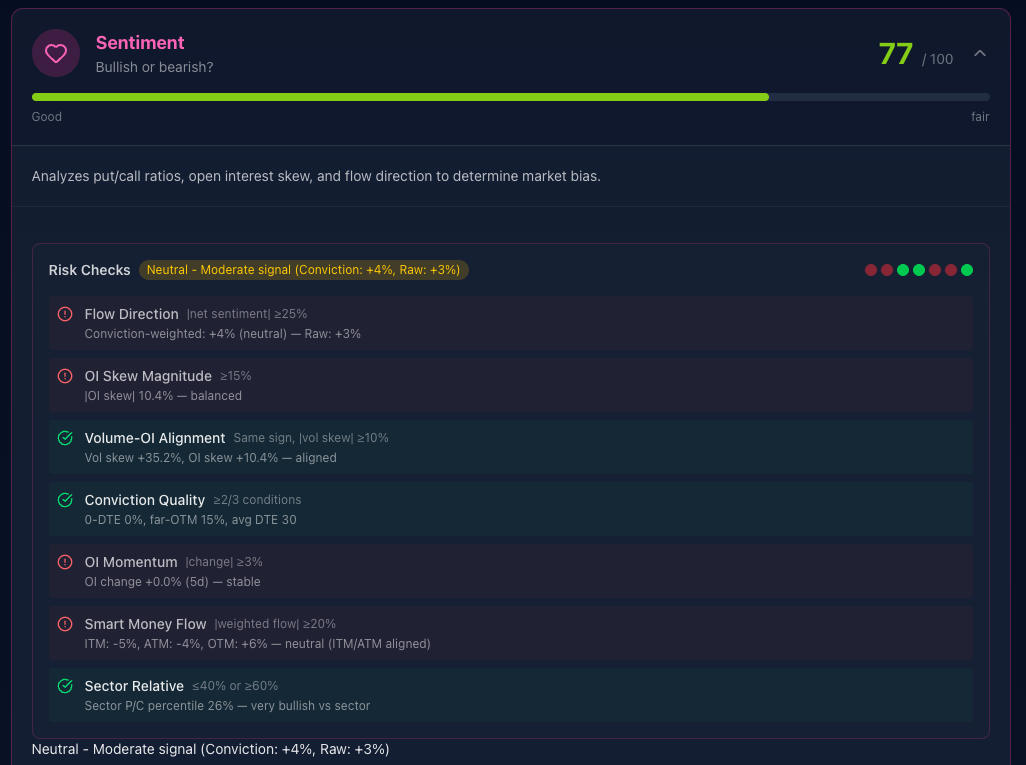
The 7 Risk Checks Explained
Here's what we actually measure for INTC:
| Check | What It Measures | Threshold | INTC | Status |
|---|---|---|---|---|
| Flow Direction | Net sentiment strength | ≥25% | +4% | ❌ Neutral |
| OI Skew Magnitude | How tilted is positioning? | ≥15% | 10.4% | ❌ Moderate |
| Volume-OI Alignment | Do volume and OI agree? | Same sign, ≥10% | Both positive | ✅ Aligned |
| Conviction Quality | Quality of the flow | ≥2/3 conditions | 0-DTE 0%, avg DTE 30 | ✅ Good |
| OI Momentum | Are positions growing? | ≥3% change | +0.0% | ❌ Stable |
| Smart Money Flow | ITM/ATM alignment | ≥20% weighted | Neutral | ❌ Mixed |
| Sector Relative | vs sector peers | ≤40% or ≥60% | 26th percentile | ✅ Very bullish vs sector |
4 of 7 checks passed. That's why the score is 77 (good) not 90+ (excellent).
Translation: The signal is bullish, but not screaming conviction. Good enough to trade, but don't bet the farm.
The Moneyness Breakdown: Where Is The Money?
This is where it gets interesting.
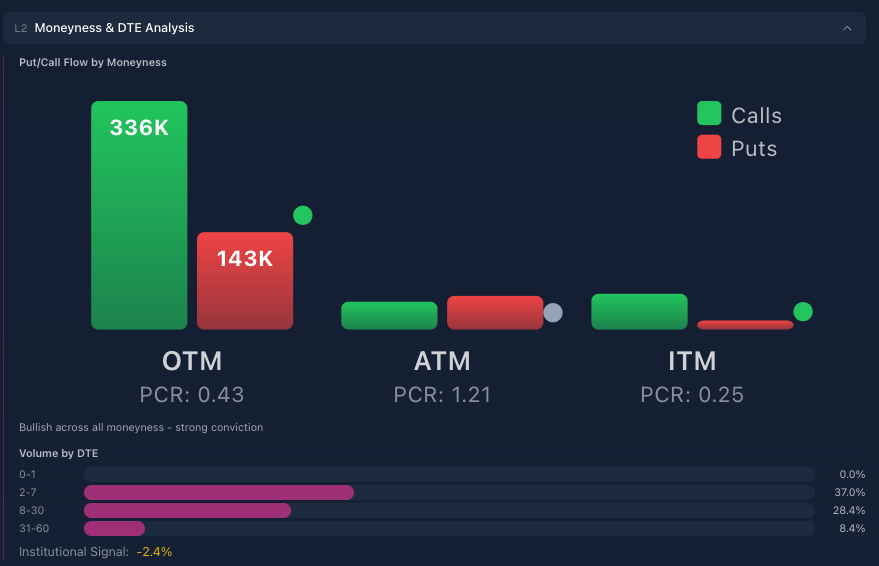
P/C ratio by strike type:
| Moneyness | Calls | Puts | P/C Ratio | Who's Trading |
|---|---|---|---|---|
| OTM | 336K | 143K | 0.43 | Speculative retail |
| ATM | 41K | 49K | 1.21 | Directional traders |
| ITM | 53K | 13K | 0.25 | Institutional money |
What this tells us:
- OTM (0.43) — Retail is buying call lottery tickets. Bullish speculation.
- ATM (1.21) — Slight put bias here. Some hedging activity.
- ITM (0.25) — Institutions are heavily long calls. Real money commitment.
The insight: When ITM, ATM, and OTM all lean the same direction, that's conviction across all player types. INTC shows bullish bias at every level.
A simple P/C ratio of 0.48 can't show you this breakdown.
Volume by Time Horizon
Not all volume is created equal.
| DTE Range | % of Volume | What It Means |
|---|---|---|
| 0-1 days | 0.0% | No 0DTE noise |
| 2-7 days | 37.0% | Short-term directional |
| 8-30 days | 28.4% | Swing traders |
| 31-60 days | 8.4% | Institutional planning |
Institutional Signal: -2.4%
Translation: Most volume is in the 2-30 day range. This is healthy — it's traders with real thesis, not degenerate 0DTE gambling.
When you see 50%+ in 0-1 DTE, that's retail noise. Ignore it.
What Strategies Make Sense?
Based on the sentiment data, here's what Options Pilot suggests:
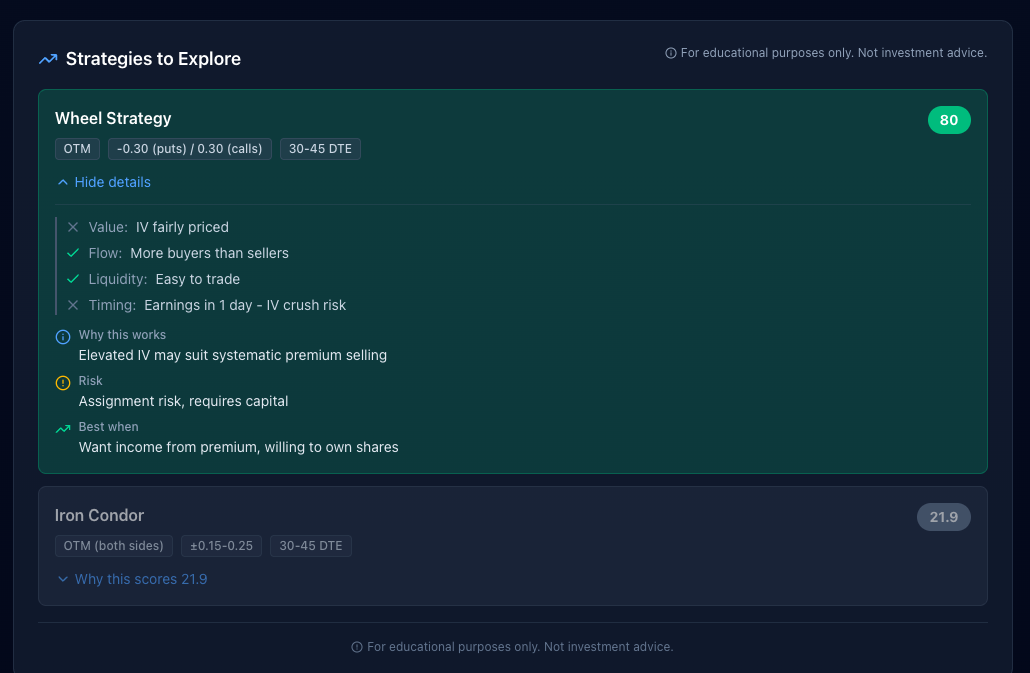
Wheel Strategy: 80/100
- Flow supports selling puts (bullish bias = put buyers are the counterparty)
- Elevated IV for premium
- Easy to trade liquidity
Iron Condor: 21.9/100
- NOT recommended — directional bias too strong
- Bullish flow means the call side is risky
- Better to pick a direction here
The Simple Framework
Here's how to use SENTIMENT in your trading:
| SENTIMENT Score | Signal Clarity | What To Do |
|---|---|---|
| 80-100 | Crystal clear | Trade with confidence, full size |
| 60-79 | Good clarity | Tradeable signal, normal size |
| 40-59 | Mixed signals | Wait for clarity or reduce size |
| 20-39 | Conflicting | Avoid directional bets |
| 0-19 | Clear bearish | Put-focused strategies |
INTC at 77? Good signal clarity. The options market is leaning bullish with moderate conviction. Tradeable.
Why "Signal Clarity" Not "Bullish/Bearish"?
Here's something most platforms get wrong:
A strong bearish signal is just as valuable as a strong bullish signal.
If everyone is betting the stock will drop, that's useful information — for put buyers AND for contrarians.
What's NOT useful is unclear signals. When half the data says bullish and half says bearish, you have no edge.
SENTIMENT measures clarity, not just direction.
- Score 85 with bearish direction = Great setup for puts
- Score 85 with bullish direction = Great setup for calls
- Score 45 with any direction = No edge, wait for better setup
Get the Full Picture
SENTIMENT is one of five pillars we analyze:
- VALUE — Are options cheap or expensive?
- SENTIMENT — What are traders betting? ← You are here
- ACTIVITY — Is something unusual happening?
- LIQUIDITY — Can you trade efficiently?
- TIMING — Is now the right moment?
We score 4,000+ stocks across all five pillars. Every trading day.
Stop Trading on Half the Story
P/C ratio is a starting point, not an answer.
If you want:
- The full 7-check sentiment breakdown before you trade
- Moneyness analysis showing where smart money is positioned
- Strategy suggestions based on actual flow data
Join the Options Pilot waitlist:
Get Early Access