Pillar Deep-Dive #1: VALUE — "Are options priced right?" - NFLX options look expensive. Here's exactly how we know.
The Problem Most Traders Miss
You found a stock you like. You're bullish on the next earnings. You buy calls.
Then you watch those calls bleed 30% over the next week — even though the stock went up.
What happened? You bought expensive options.
This is one of the most common (and costly) mistakes in options trading. The stock moved in your favor, but you still lost money because you overpaid for the option.
The VALUE pillar exists to answer one question: "Am I getting a fair price?"
What Makes Options "Expensive" or "Cheap"?
Think of it like buying a car.
A Honda Civic costs ~$25K. If someone offers you one for $15K, that's cheap. If they want $40K, that's expensive.
Options work the same way. The "price" of an option isn't just the premium — it's the implied volatility (IV) baked into that premium.
- High IV = Options are expensive (you're paying a premium for uncertainty)
- Low IV = Options are cheap (market expects calm)
But here's the key: "expensive" and "cheap" are relative.
NFLX options at 40% IV might be cheap (it often trades at 50%+). A utility stock at 40% IV might be extremely expensive (it usually trades at 15%).
That's why we compare IV across three dimensions:
- vs. its own history (Is NFLX IV high for NFLX?)
- vs. sector peers (Is NFLX IV high compared to other tech/streaming stocks?)
- vs. the whole market (Is NFLX IV high compared to 5,900+ stocks?)
Real Example: NFLX Today
Let's look at Netflix (NFLX) right now using Options Pilot:
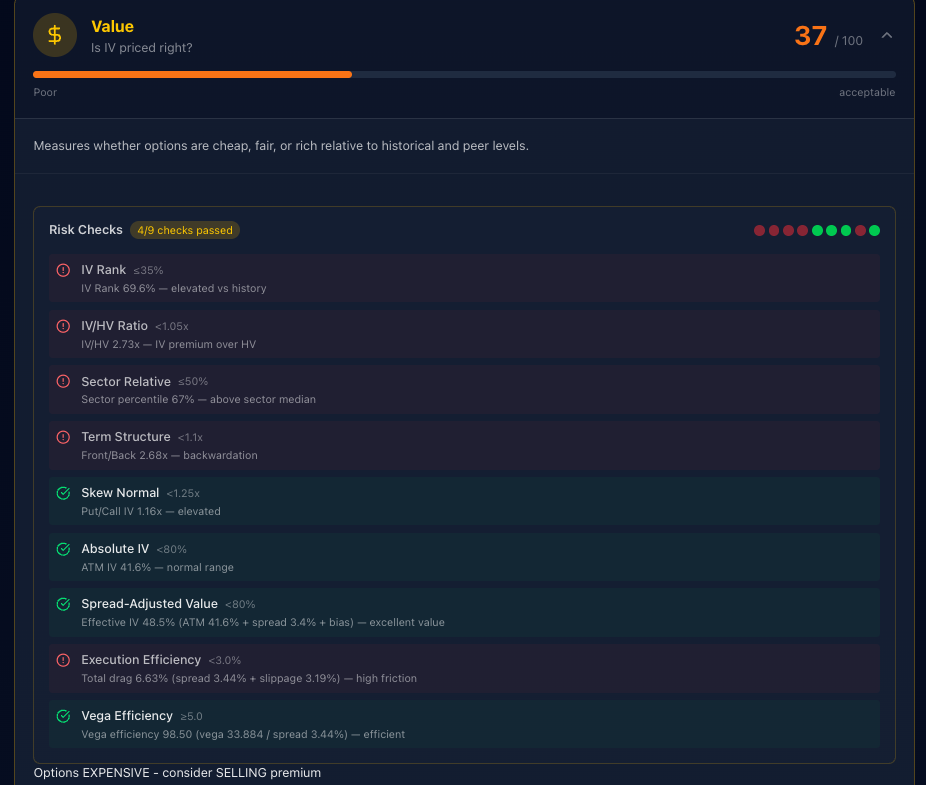
VALUE Score: 37/100 — Options are EXPENSIVE.
Here's what the Risk Checks tell us:
| Check | Threshold | NFLX | Status |
|---|---|---|---|
| IV Rank | ≤35% | 69.6% | ❌ Failed |
| IV/HV Ratio | <1.05x | 2.73x | ❌ Failed |
| Sector Relative | ≤50% | 67% | ❌ Failed |
| Term Structure | <1.1x | 2.68x | ❌ Failed |
| Skew Normal | <1.25x | 1.16x | ✅ Passed |
| Absolute IV | <80% | 41.6% | ✅ Passed |
| Spread-Adjusted Value | <80% | 48.5% | ✅ Passed |
| Execution Efficiency | <3.0% | 6.63% | ❌ Failed |
| Vega Efficiency | ≤5.0 | 98.50 | ✅ Passed |
Translation for regular humans:
- IV Rank 69.6% — NFLX options are more expensive than 69.6% of the past year. Not cheap.
- IV/HV Ratio 2.73x — You're paying 2.73x what the stock actually moved recently. That's a big premium.
- Sector percentile 67% — Even among tech stocks, NFLX options are pricier than average.
- Term Structure 2.68x — Front-month IV is much higher than back-month. Classic earnings premium.
Bottom line: If you're BUYING options on NFLX right now, you're swimming upstream.
The Term Structure Tells a Story
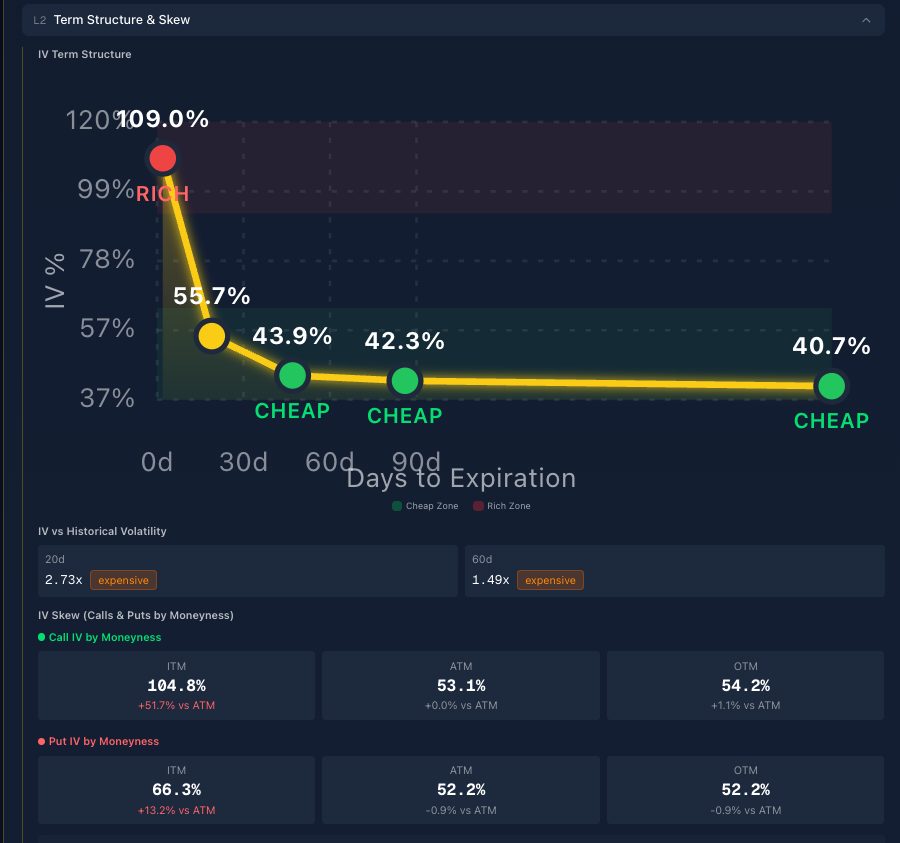
This chart shows IV across different expiration dates:
- Weekly DTE: 109% — Extremely elevated (earnings week)
- 30 DTE: 43.9% — Much cheaper
- 60 DTE: 42.3% — Even cheaper
- 120 DTE: 40.7% — Cheapest zone
The green "CHEAP" labels show where options offer better value. The red "RICH" zone at weekly DTE screams "avoid buying here."
What this means for you:
- Option buyers: Look at 30+ DTE expirations for better value
- Option sellers: Front-month premium is juicy — that's where the opportunity is
The IV Skew section shows how calls vs. puts are priced:
- ITM Calls: 104.8% (very expensive)
- ATM: ~53% (baseline)
- OTM Calls: 54.2% (slightly above ATM)
This tells us call buyers are paying up big. Speculation is running hot.
Historical Context: Where Are We?
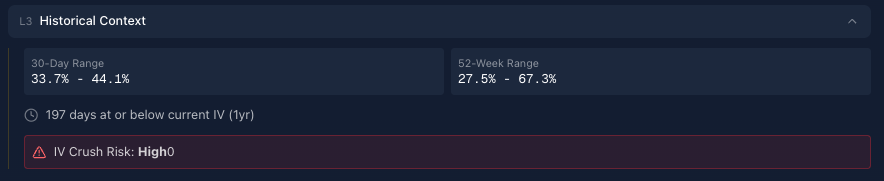
- 30-Day Range: 33.7% - 44.1%
- 52-Week Range: 27.5% - 67.3%
- 197 days at or below current IV — Current IV is higher than most of the past year
- IV Crush Risk: HIGH — Earnings approaching, expect volatility to drop after
This is crucial context. NFLX IV can get as low as 27.5%, and we're currently near the top of the range.
So What Should You Actually DO?
When VALUE is low (options expensive), consider:
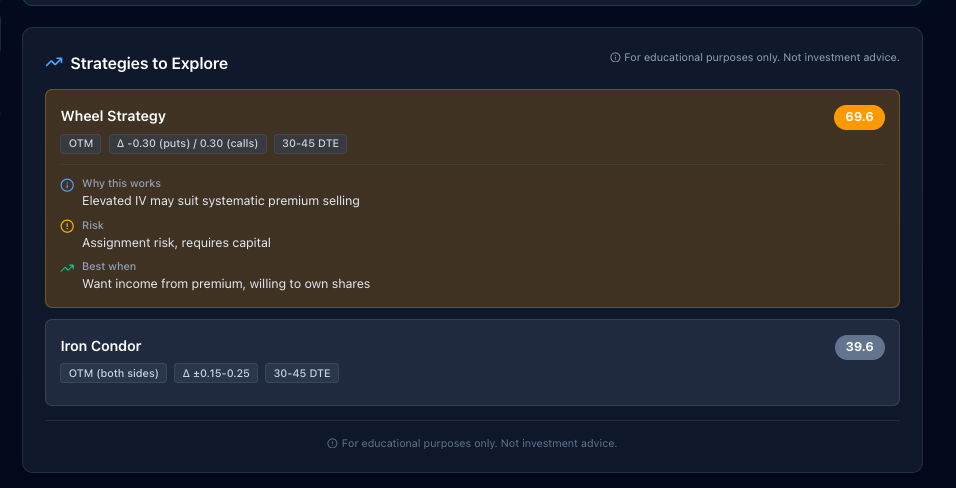
Wheel Strategy (Score: 69.6) — Sell cash-secured puts to collect that premium
- Works because: Elevated IV = fatter premiums for sellers
- Risk: Assignment if stock drops hard
- Best when: You're okay owning shares at lower prices
Iron Condor (Score: 39.6) — Collect premium from both sides
- Works because: High IV + defined risk
- Risk: Stock moves beyond your strikes
- Best when: You expect the stock to stay in a range
The Simple Framework
Here's how to use VALUE in your trading:
| VALUE Score | What It Means | Strategy Bias |
|---|---|---|
| 80-100 | Options CHEAP | Buy calls/puts |
| 60-79 | Reasonably priced | Either |
| 40-59 | Fair value | Neutral |
| 20-39 | Options EXPENSIVE | Sell premium |
| 0-19 | Extremely rich | Avoid buying |
NFLX at 37? Options expensive. Favor selling strategies or wait for IV to drop.
Why This Matters
Every point of IV costs you money when you buy options.
If you buy a call at 60% IV and sell it at 50% IV (even if the stock is flat), you lose ~15-20% of your premium to "IV crush."
VALUE helps you avoid this trap by showing you:
- Whether you're overpaying
- Where the better value is (different expirations)
- What strategies make sense given current pricing
Get the Full Picture
VALUE is just one of five pillars we analyze. The others:
- SENTIMENT — What are traders betting?
- ACTIVITY — Is something unusual happening?
- LIQUIDITY — Can you trade efficiently?
- TIMING — Is now the right moment?
We score 4000+ stocks across all five pillars. Every trading day.
Want to see this for any stock?
We're opening Options Pilot to a small group first.
If you want:
- Pre-market VALUE scores before you trade
- IV term structure at a glance
- Strategy suggestions based on current conditions