Magic Signal
TLDR
What It Does
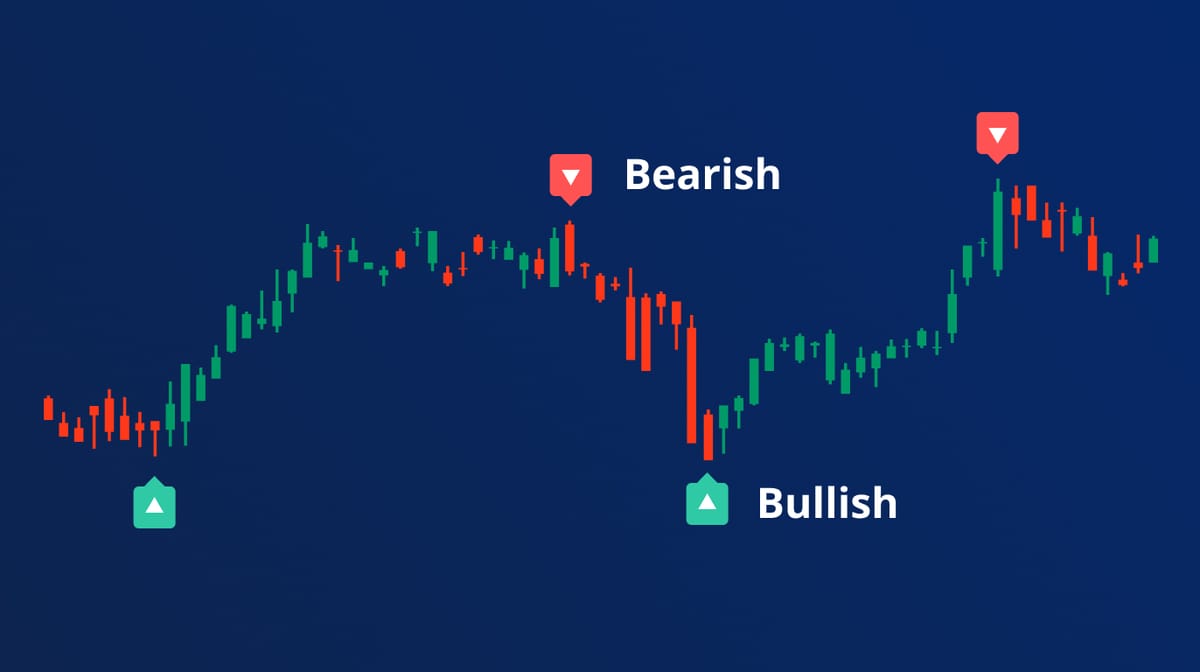
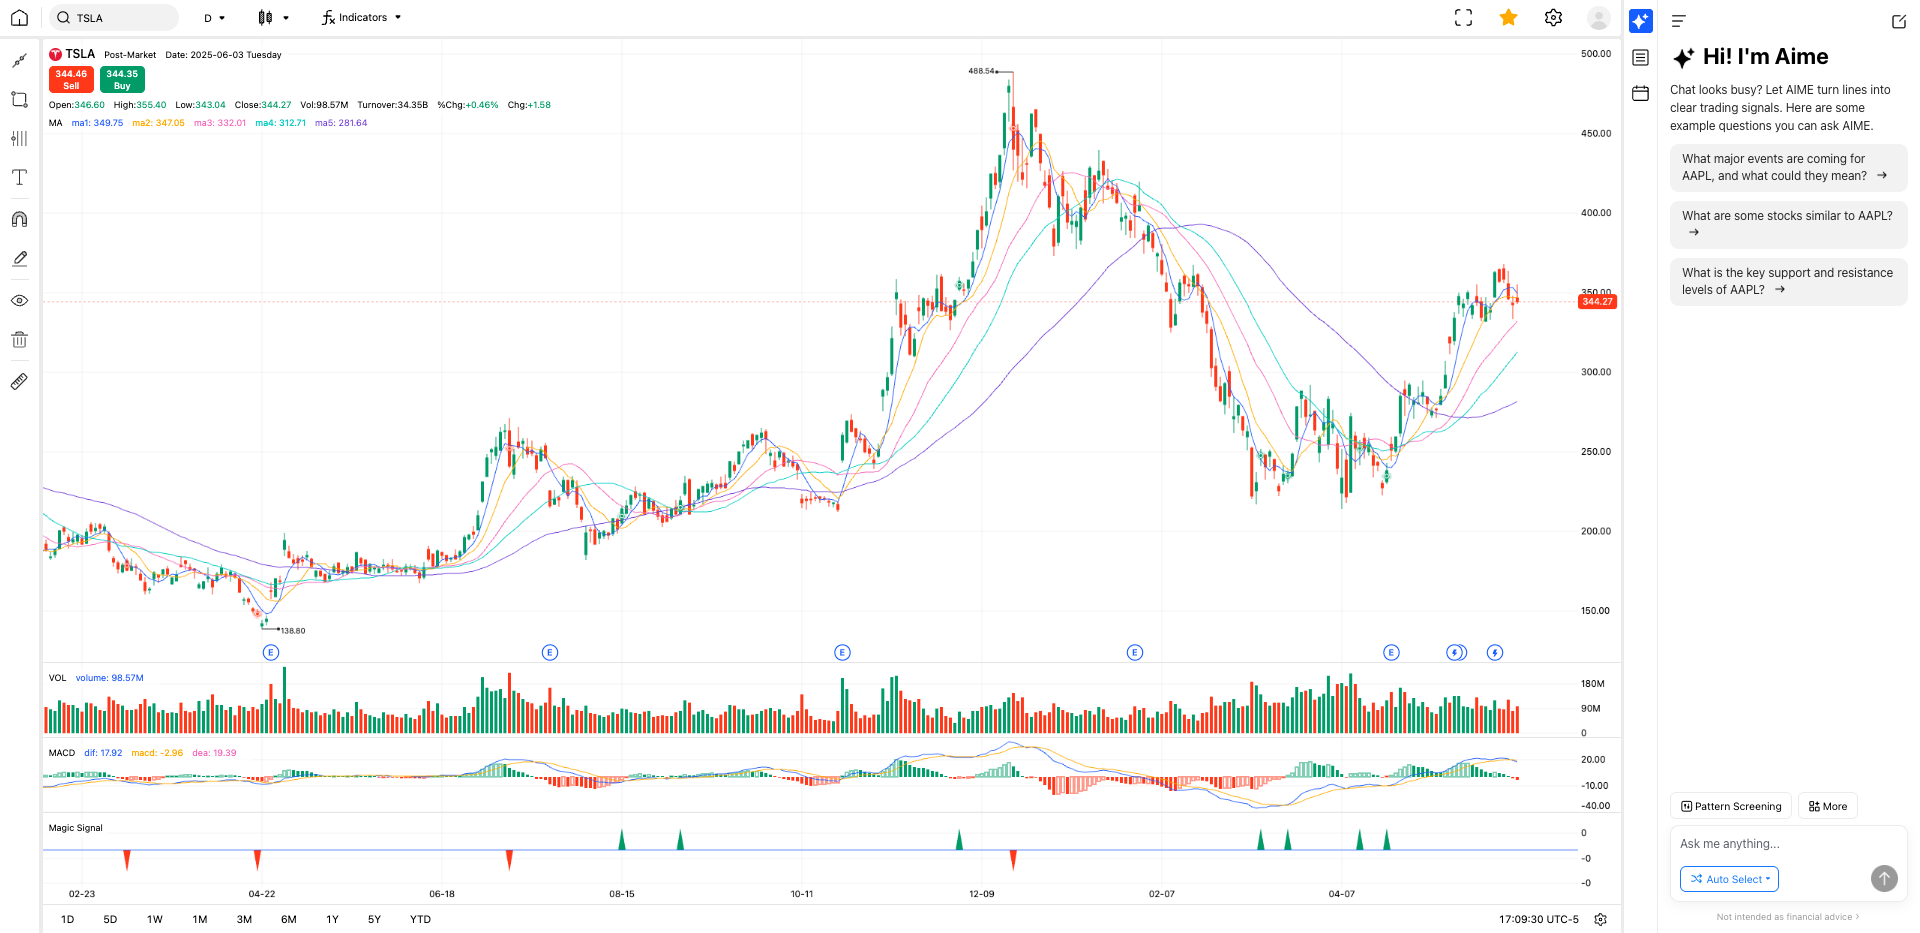
Shows green dots (buy signal) and red dots (sell signal) on charts.
Key Rules
- Only updates after market close
- For swing trading, not day trading
- Don't trade alone - use with other indicators
How to Use
- Green dot = Consider buying/adding
- Red dot = Consider selling/reducing
- Make decisions for next day, not same day
Try Magic Signal for your trading now
What is Magic Signal?
The Magic Signal is a technical analysis system that utilizes proprietary feature engineering methodologies. Through advanced quantitative analysis, different categories of factor groups are extracted from historical volume and price data series. These factors are then processed using sophisticated mathematical algorithms and statistical models to identify trend patterns, bullish and bearish inflection points across bull and bear market cycles respectively. Finally, the analysis results from multiple technical frameworks are synthesized to generate the final magic signal. It's an advanced technical indicator designed for application on barchart platforms.
Try Magic Signal for your trading now
Backtest with holding period with stocks and ETFs
Market Cap Sweet Spots: Where Magic Signal Shines on stocks
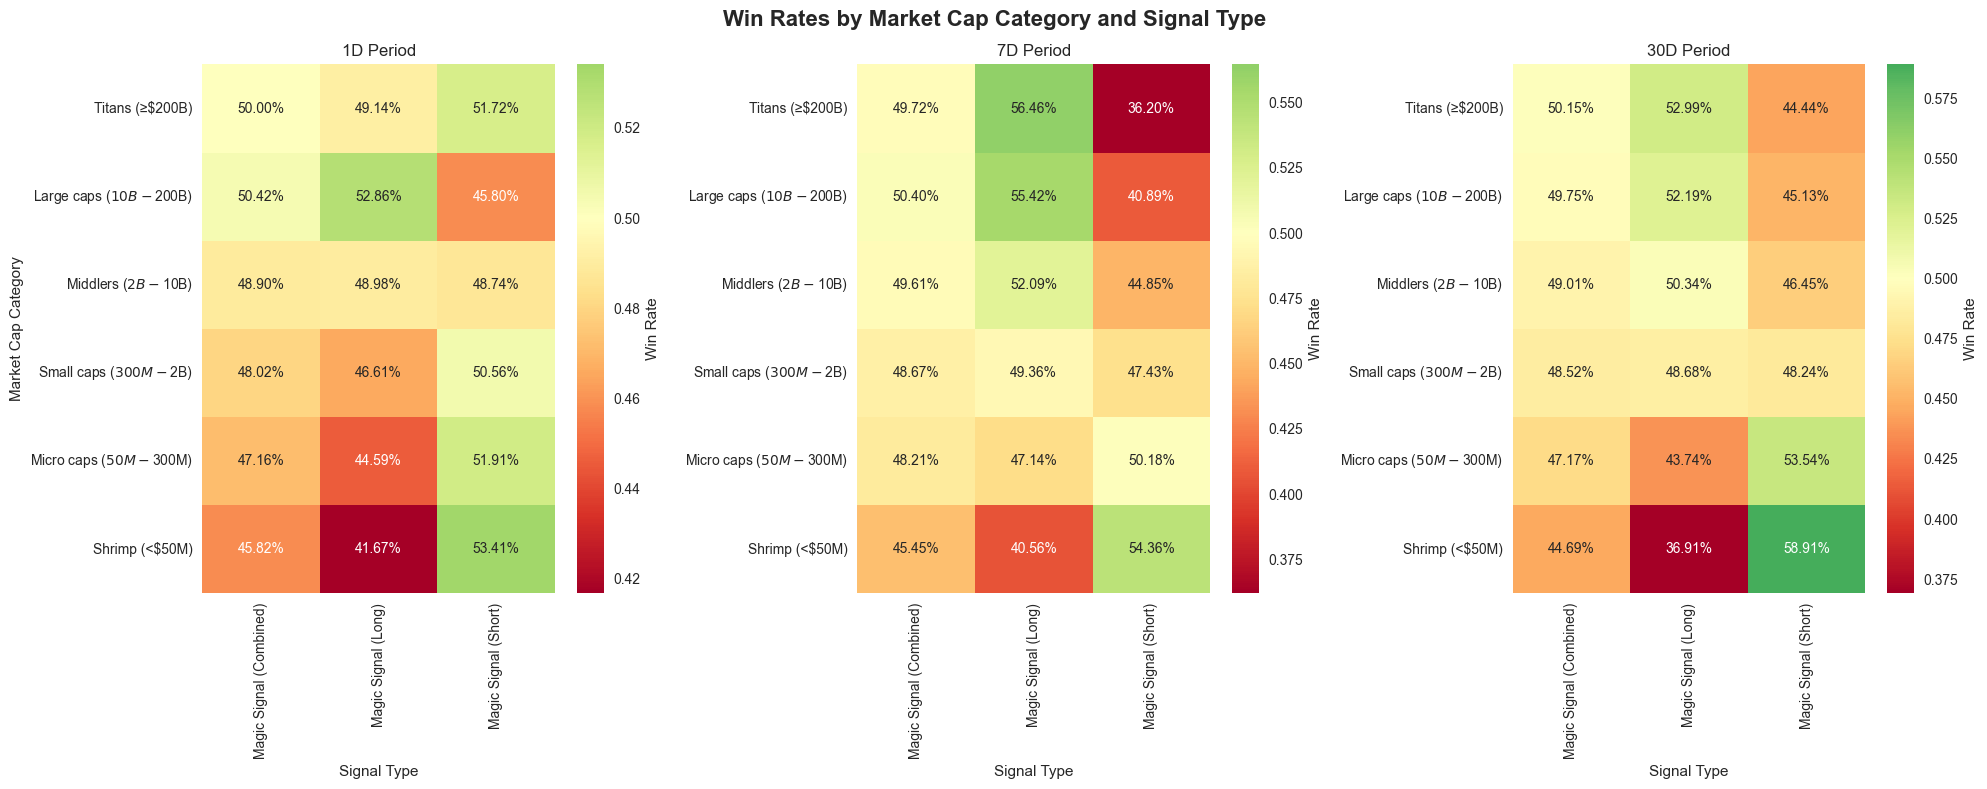
The data reveals distinct performance patterns across different market capitalizations. Magic Signal (Long) demonstrates its strongest edge in large-cap and titan stocks (≥$10B market cap), consistently delivering win rates above 50% across all time periods. For investors focusing on established, liquid names, the long signals provide reliable alpha generation.
Conversely, Magic Signal (Short) finds its groove in the small-cap universe, particularly excelling in micro-cap and shrimp stocks (<$300M). The 30-day performance in shrimp stocks stands out dramatically, achieving an impressive 58.91% win rate—suggesting the signal effectively identifies overvalued smaller companies ripe for correction.
Time Horizon Optimization
The signal's effectiveness varies significantly across different holding periods. Short-term traders (1-day holds) see the most balanced performance across market caps, with win rates clustering around 45-50%. This suggests the signal captures immediate market inefficiencies regardless of company size.
Medium-term positions (7-30 days) reveal where specialization pays off. Long signals in large caps maintain their edge over extended periods, while short signals in small caps actually improve with time, reaching peak performance in the 30-day window. This indicates the signal successfully identifies fundamental mispricing that takes weeks to correct in smaller, less efficient markets.
ETF Giants: Where Magic Signal Dominates
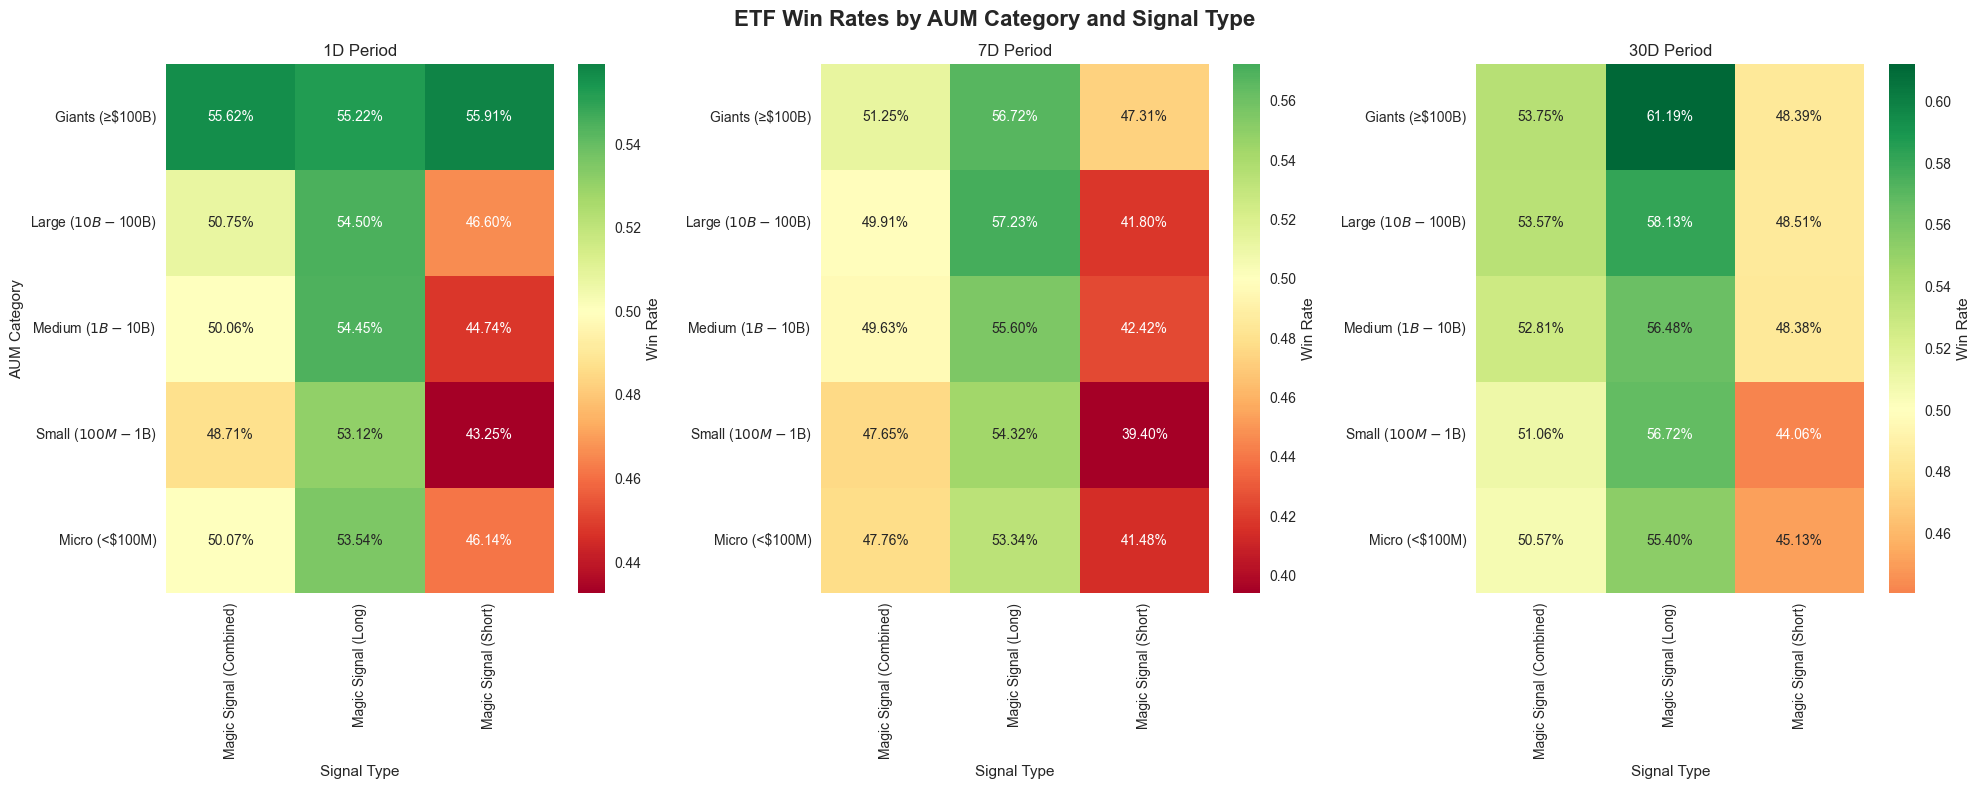
Giant ETFs (≥$100B AUM) represent Magic Signal's strongest playground, delivering exceptional performance that actually improves over longer time horizons. The Magic Signal (Long) achieves a remarkable 61.19% win rate over 30-day periods in this category—the highest performance across the entire dataset.
This makes intuitive sense: mega-cap ETFs like SPY, QQQ, and IWM have enormous institutional flows, predictable rebalancing patterns, and strong momentum characteristics that Magic Signal's algorithms can effectively capture. For systematic ETF traders, focusing long signals on the largest, most liquid funds provides the most reliable alpha generation.
The Long Signal Advantage in ETF Trading
Magic Signal (Long) consistently outperforms across all ETF categories and time horizons, making it the clear winner for ETF-focused strategies. Unlike individual stocks where short signals excel in small caps, ETF structures and their inherent diversification seem to favor bullish momentum signals.
The performance gap becomes most pronounced in longer holding periods. While 1-day results show modest edges, 30-day holds reveal Magic Signal (Long)'s true strength, with win rates exceeding 55% across all AUM categories. This suggests the signal successfully identifies ETF momentum that builds over weeks rather than days.
AUM-Based Strategy Optimization
The data reveals a clear inverse relationship between ETF size and short signal effectiveness. Magic Signal (Short) struggles most with larger ETFs, achieving win rates below 45% in Giant and Large categories over longer periods. This contrasts sharply with individual stock performance, where smaller market caps favor short signals.
Small and Micro ETFs (≤$1B AUM) show the most balanced performance across signal types, suggesting these lesser-followed funds experience more two-way volatility that both long and short signals can exploit. However, even in these categories, the long signal maintains a meaningful edge.
Time Horizon Considerations for ETF Strategies
Short-term ETF trading (1-day holds) provides the most consistent results across all signal types and AUM categories, with win rates clustering tightly around 50-55%. This suggests Magic Signal effectively captures daily ETF inefficiencies regardless of fund size.
Extended holding periods (30 days) create significant signal divergence. Long signals reach their peak effectiveness, particularly in larger ETFs, while short signals deteriorate markedly. This pattern indicates that ETF momentum tends to persist over monthly timeframes, making mean reversion strategies less effective than trend-following approaches.
Strategic Implementation for ETF Portfolios
The data supports a size-tiered, long-biased approach to ETF signal deployment:
- Concentrate Magic Signal (Long) in Giant and Large ETFs where institutional flows create sustained momentum patterns and liquidity supports extended position sizes
- Use Magic Signal (Combined) for smaller ETFs where the balanced approach captures both momentum and reversal opportunities in less efficient market segments
- Avoid heavy short signal allocation in ETF strategies, as the structural bid from passive flows appears to create persistent headwinds for bearish positions
The 30-day holding period emerges as the optimal timeframe for maximizing Magic Signal's ETF edge, particularly when focusing on the largest, most liquid funds where algorithmic trading advantages compound over time.
How to Use Magic Signal for Trading
Overview
Magic Signal is a trend-following indicator designed for mid to long-term trading strategies (typically up to one quarter). It provides bullish (green dots) and bearish (red dots) signals to help traders increase or decrease their positions.
Key Considerations for Using Magic Signal Effectively
1. Updated at Market Close – Not for Intraday Trading
- The list of stocks receiving a Magic Signal update is refreshed at market close
- Traders should use this information for the next trading session rather than intraday trades
- Since Magic Signal is not designed for real-time or day trading, users should avoid making impulsive trades during market hours based solely on short-term price movements
2. How to Interpret the Signals
Green Dot (Bullish Signal) → Suggests an increase in position size for a potential mid-to-long-term uptrend.
Red Dot (Bearish Signal) → Indicates it might be time to take profits, reduce exposure, or exit a position.
Step-by-Step Guide to Trading with Magic Signal
Step 1: Identify the Magic Signal After Market Close
- At the end of each trading session, review the updated Magic Signal list
- Look at the newly generated bullish and bearish signals and compare them with broader market trends
Step 2: Confirm the Signal with Other Indicators
Magic Signal works best when combined with other technical indicators to confirm its reliability. Use these tools to strengthen your decision-making:
Trend Sight Indicator – Confirms if the stock is in a sustained bullish or bearish trend based on technical analysis
- Moving Averages (MA20, MA50, MA200) – Ensures alignment with long-term trends
- MACD & RSI – Check if momentum is truly shifting up or down
- Support & Resistance Levels – Ensure you're not buying into a resistance zone or selling near support
Step 3: Plan Your Trade for the Next Session
- If a stock appears on the bullish signal list, prepare to enter or add to a position at the next trading session
- If a stock appears on the bearish signal list, consider reducing your position at the next open or setting a stop-loss
Step 4: Monitor & Adjust Over Time
- Since Magic Signal is designed for mid-to-long-term trading, weekly reviews are recommended
- Adjust positions gradually rather than making drastic moves
Example Trade Using Magic Signal + Trend Sight
Bullish Example (Green Dot – Bullish Signal)
Tesla (TSLA) receives a green dot at market close on 4/22/2025.
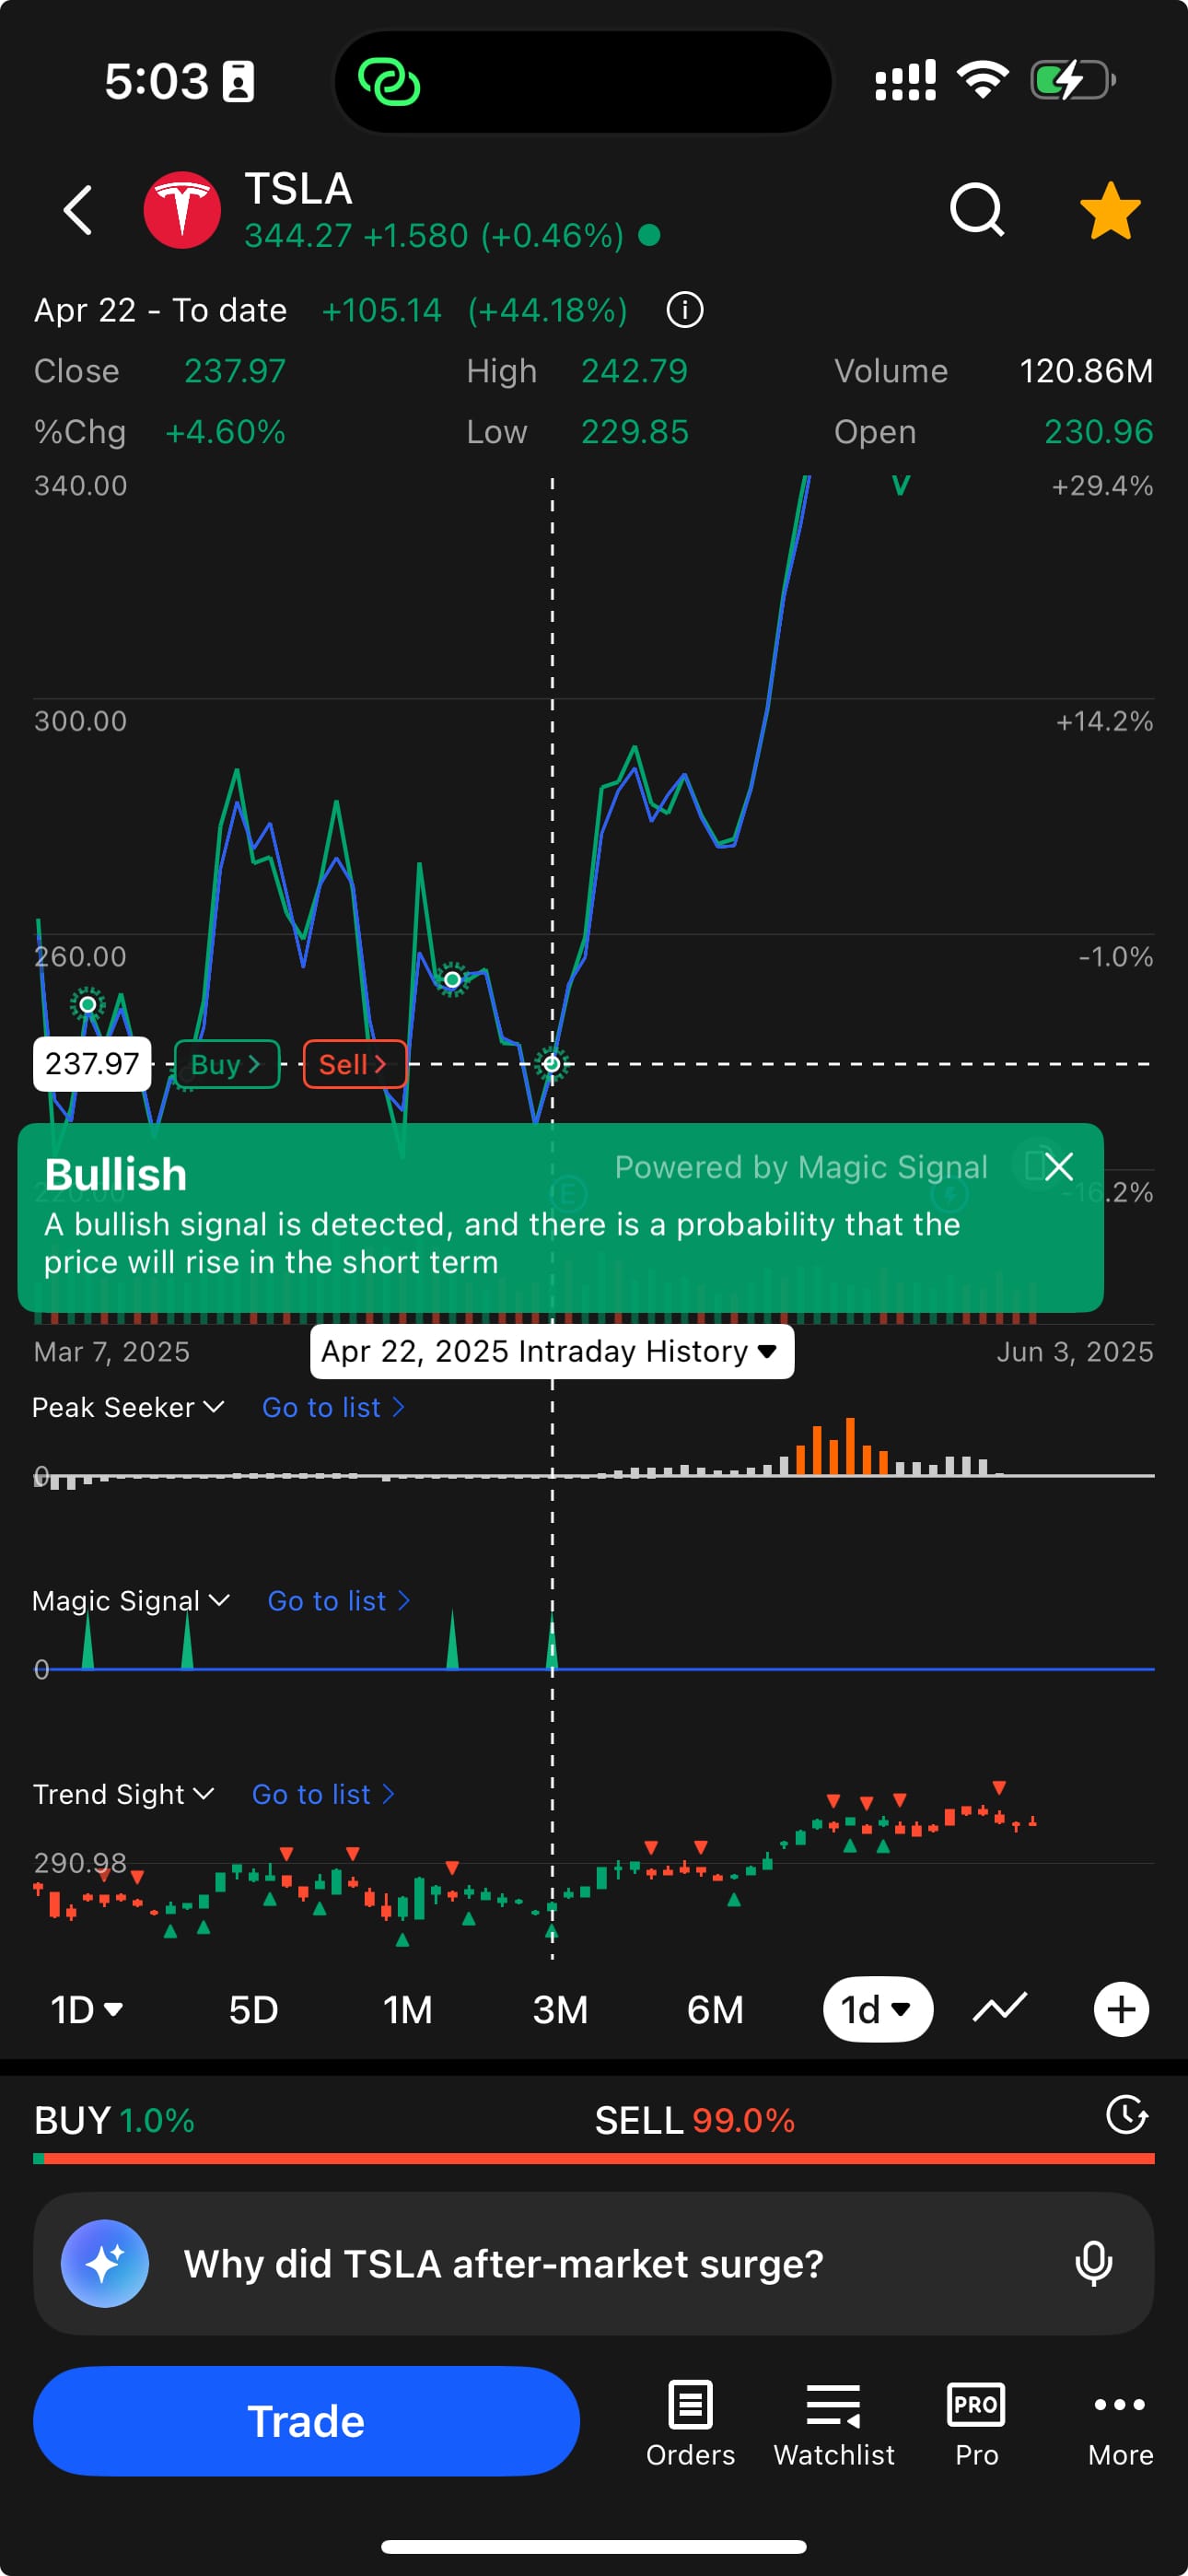
You check Trend Sight, which shows a strong uptrend.
On Next day morning, you may enter a position with risk control.
Bearish Example (Red Dot – Bearish Signal)

Nvidia (NVDA) receives a red dot at market close on 4/3/2025 .
Trend Sight confirms a weakening trend, showing bearish momentum.
On 4/5/2025, you cover your short position , securing nice profits before the reversal.
Final Takeaways
- Magic Signal is refreshed at market close → Make trade decisions for the next session
- Designed for mid-to-long-term trading (weeks to months) not for intraday trading
- Use multiple confirmations before acting → Combine it with Trend Sight, moving averages, MACD, and RSI etc.
- Gradually adjust positions rather than making sudden trades based on one signal
- By integrating Magic Signal with Trend Sight and other technical indicators, traders can increase confidence in their trades and maximize profitability while managing the risk
You can also check out video instructions on how to use magic signal here:
Try Magic Signal for your trading now