How to Navigate Earnings Season with a Ainvest Options Scoring System
TSLA, META, MSFT, IBM - A Real Case Study from January 28, 2026
For educational purposes only. Not investment advice.
Earnings season is the Super Bowl of options trading. Four times a year, hundreds of companies report quarterly results, and the options market goes into overdrive. Implied volatility spikes. After-hours gaps create overnight fortunes and losses. Retail traders scramble to figure out which names to play and which to avoid.
Here is the problem: on a single night like January 28, 2026, four mega-cap companies (TSLA, META, MSFT, IBM) all report after the bell. Each has different IV levels, different options flow, different liquidity profiles. How do you quickly assess all four and decide where conditions are favorable?
Most traders rely on gut feeling or a single metric like implied volatility. That is not enough. You need a framework that evaluates multiple dimensions simultaneously and tells you not just whether to trade, but how conditions favor different strategies.
That is exactly what the AInvest Option Scoring System does. And on January 28, 2026, we put it to the test.
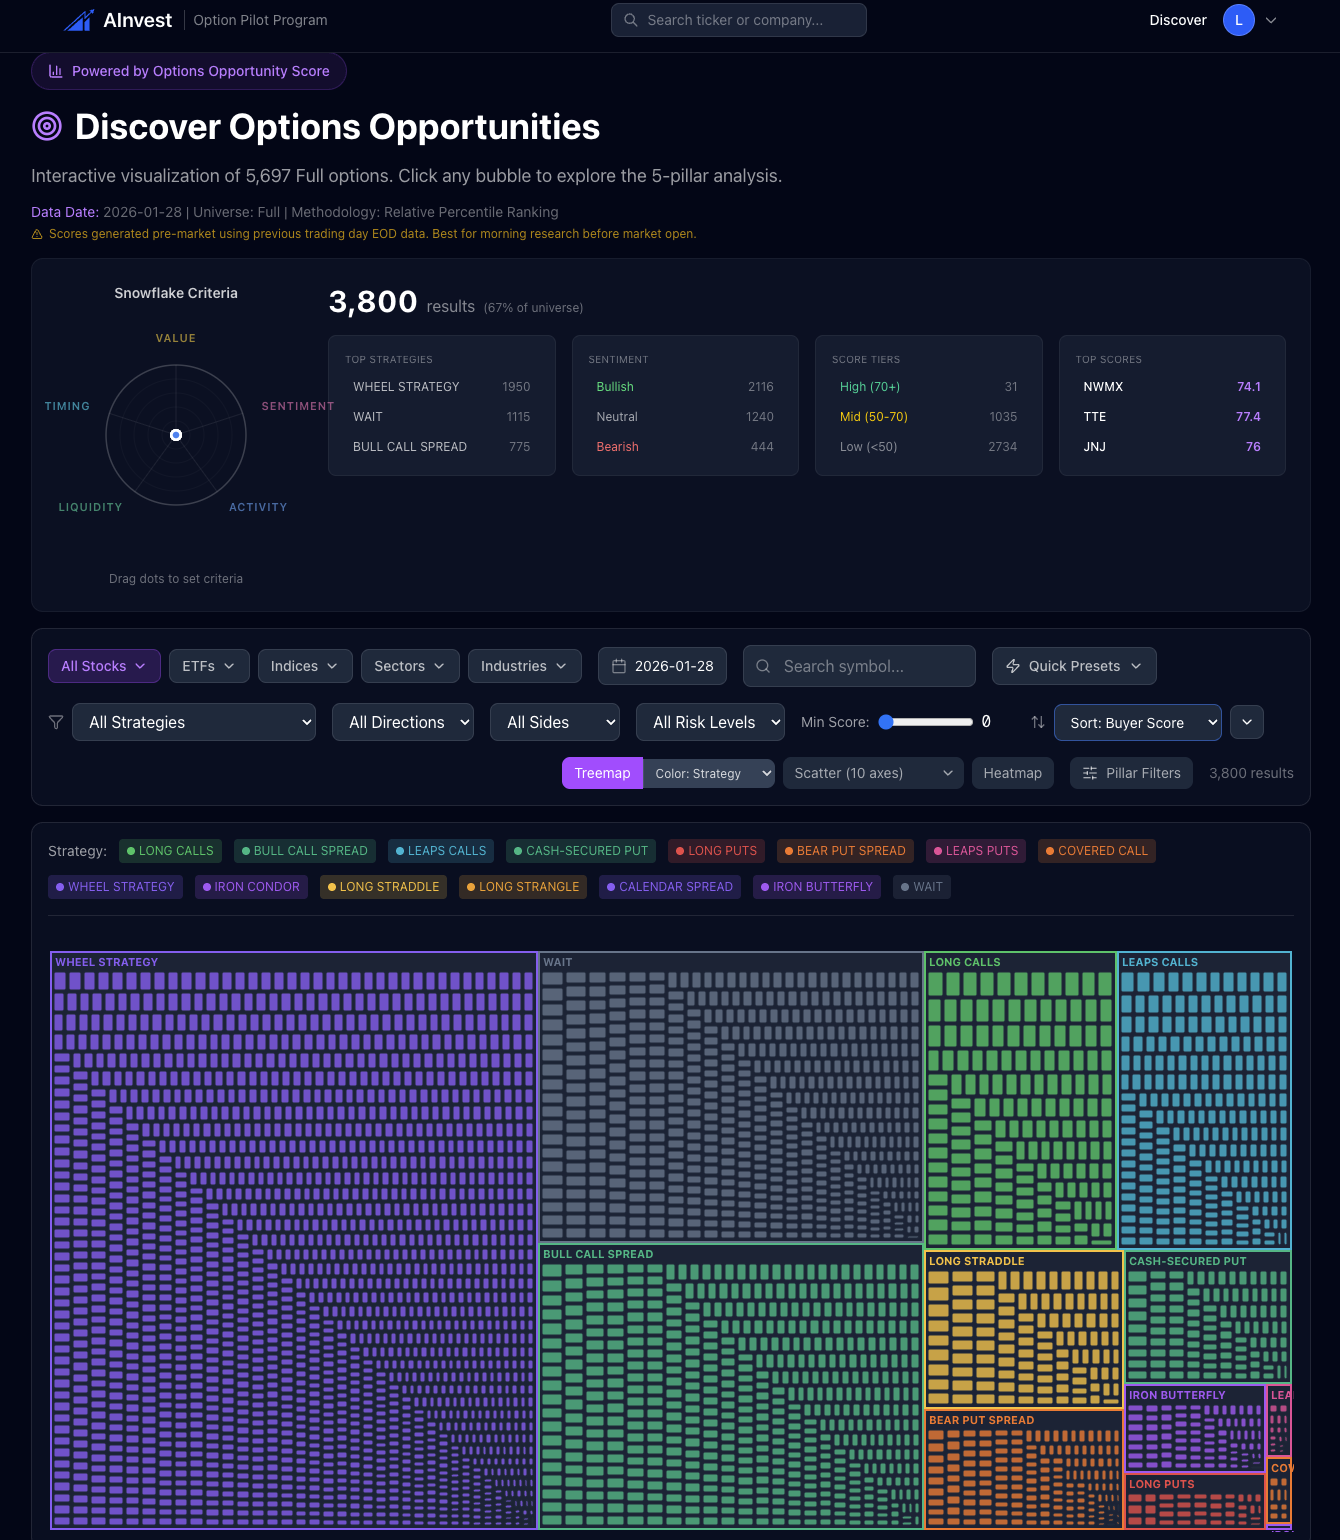
What is the Option Scoring System?
The Option Scoring System evaluates every optionable stock across 5 pillars, each scored from 0 to 100:
| Pillar | Question It Answers |
|---|---|
| Value | Is implied volatility cheap or expensive relative to history? |
| Sentiment | What direction are options traders actually betting? |
| Activity | Is something unusual happening in the options market? |
| Liquidity | Can you trade this efficiently without getting crushed by spreads? |
| Timing | Is now a good time to enter, or is there event risk ahead? |
Each pillar runs 6 transparent sub-checks (30 total) that you can inspect. No black box. You see exactly which factors passed and which failed, just like a health checkup for options conditions.
The results are displayed in a snowflake chart that gives you an instant visual read on where the stock stands across all five dimensions. A well-rounded snowflake means conditions are favorable across the board. A lopsided snowflake tells you where the risks and opportunities are hiding.
Want to dive deeper into any pillar? We have detailed breakdowns for each: Value | Sentiment | Activity | Liquidity | Timing
The Earnings Challenge
Earnings season creates a unique set of problems for options traders:
- IV Crush: Implied volatility is elevated before earnings and collapses immediately after the announcement. If you bought options at inflated IV, you can be right on direction and still lose money.
- Directional Uncertainty: Nobody knows which way the stock will move. Beating estimates doesn't guarantee a rally. Missing estimates doesn't guarantee a drop.
- After-Hours Gaps: The stock moves in extended hours when most options can't be traded. By the time the market opens, the opportunity (or damage) is already done.
- Multiple Simultaneous Events: On busy earnings nights, several major companies report at once. You can't deeply analyze all of them in real time.
The scoring system doesn't try to predict which way earnings will go. Instead, it assesses the conditions around each stock's options market so you can make more informed decisions about whether and how to engage.
Case Study: January 28, 2026 - Four Mega-Caps Report After the Bell
On the evening of January 28, 2026, four of the most heavily traded stocks in the options market all reported earnings after market close:
- Tesla (TSLA) - $430.90 at the close
- Meta Platforms (META) - $672.97 at the close
- Microsoft (MSFT) - $480.58 at the close
- IBM - $293.86 at the close
Before earnings were announced, the Option Scoring System generated a scorecard for each. Here is what it showed:
Pre-Earnings Scorecards at a Glance
| Ticker | Value | Sentiment | Activity | Liquidity | Timing | Overall Read |
|---|---|---|---|---|---|---|
| TSLA | 69 | 65 | 89 | 81 | 24 | IV elevated, unusual activity, imminent event risk |
| META | 46 | 68 | 58 | 91 | 47 | Bullish flow, excellent liquidity, elevated activity |
| MSFT | 49 | 65 | 46 | 85 | 62 | No clear edge detected, neutral conditions |
| IBM | 67 | 51 | 7 | 31 | 8 | High value but low activity and poor liquidity |
What Actually Happened After Hours
Using historical price data, here are the after-hours reactions:
| Ticker | Close (1/28) | After-Hours Price | After-Hours Move | Next Day Close (1/29) |
|---|---|---|---|---|
| TSLA | $430.90 | $443.99 | +3.0% | $431.46 |
| META | $672.97 | $730.18 | +8.5% | $668.73 |
| MSFT | $480.58 | $456.05 | -5.1% | $481.63 |
| IBM | $293.86 | $317.00 | +7.9% | $294.16 |
All four stocks moved significantly after hours. But the next day tells a different story: META and IBM gave back most of their after-hours gains, while MSFT recovered nearly all of its drop. This is exactly the kind of volatility the scoring system is designed to help you navigate.
Now, let's look at what each scorecard revealed before any of this happened.
IBM: The Quiet Setup That Exploded
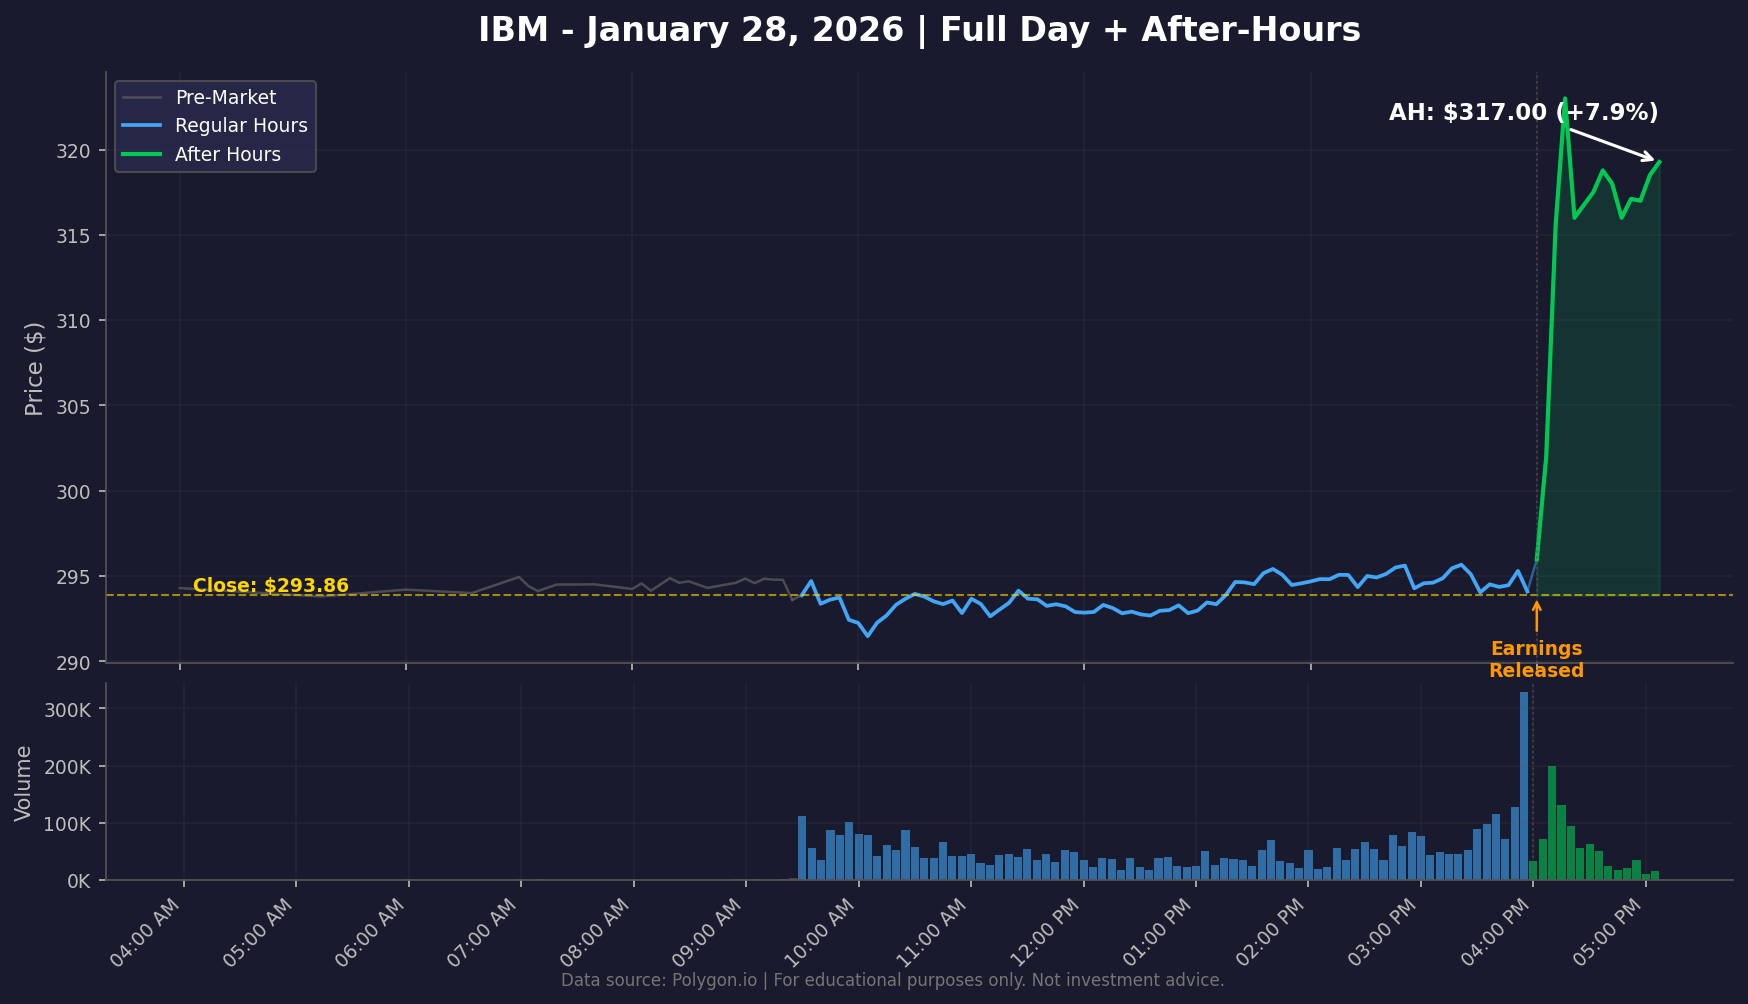
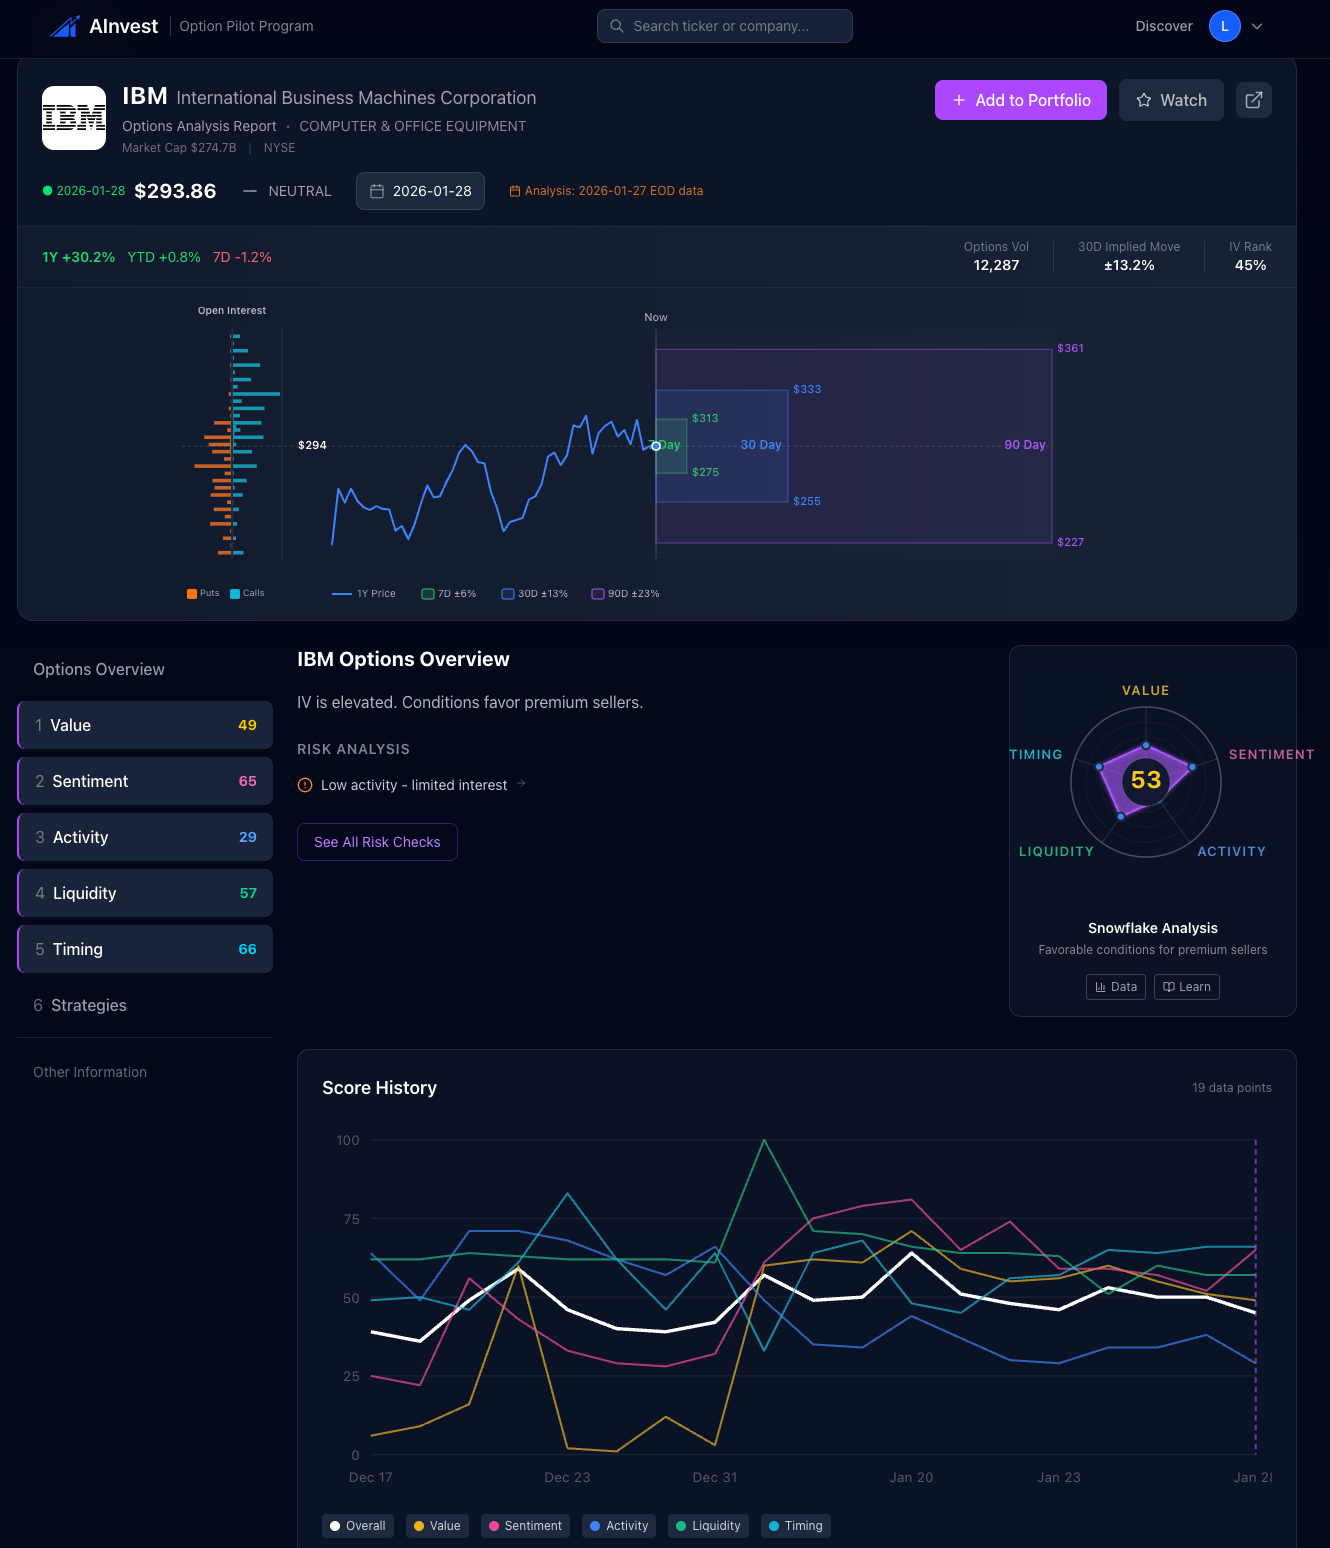
Pre-Earnings Scores: Value 67 | Sentiment 51 | Activity 7 | Liquidity 31 | Timing 8
The system's read: "IV is elevated. Conditions favor premium sellers."
IBM's scorecard was fascinating. The Value score of 67 indicated that implied volatility was elevated relative to IBM's own history, creating conditions that favor premium sellers. Meanwhile, the Activity score of 7 was nearly flatlined. Almost no unusual options activity. The options market was quiet on IBM heading into earnings.
The Liquidity score of 31 was a clear warning: IBM's options spreads are wider than mega-cap peers. Trading costs would eat into any strategy.
The Timing score of 8 was the lowest of all four stocks. The system correctly flagged that earnings were imminent, representing maximum event risk.
What happened?
IBM surged +7.9% after hours, jumping from $293.86 to $317.00. A massive move for a stock that typically doesn't swing that hard.
What the system surfaced
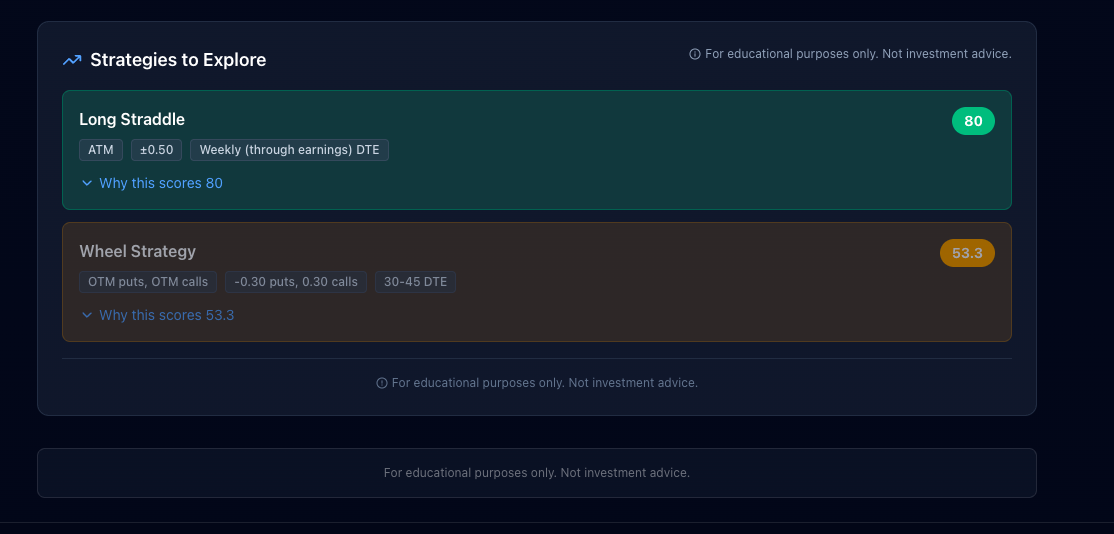
The top strategy bias was Long Straddle (score: 80). A Long Straddle profits from a large move in either direction. It doesn't need to predict whether the stock goes up or down. Given that IV was elevated (Value 67) and earnings were imminent (Timing 8), the system's logic was: conditions favor a big move, and straddles capture big moves.
The second strategy bias was Iron Condor (score: 73.1), which profits when the stock stays within a range. This might seem contradictory, but it reflects a different edge: if IV is elevated but the actual move is smaller than what the options market is pricing, the condor wins through IV crush.
Key insight: The system didn't predict IBM would rally 7.9%. It identified that conditions favored volatility strategies. A Long Straddle would have captured that move regardless of direction. But the low Liquidity score (31) was a real warning: execution costs would have been meaningful.
META: Bullish Flow + Best Liquidity = Clean Setup
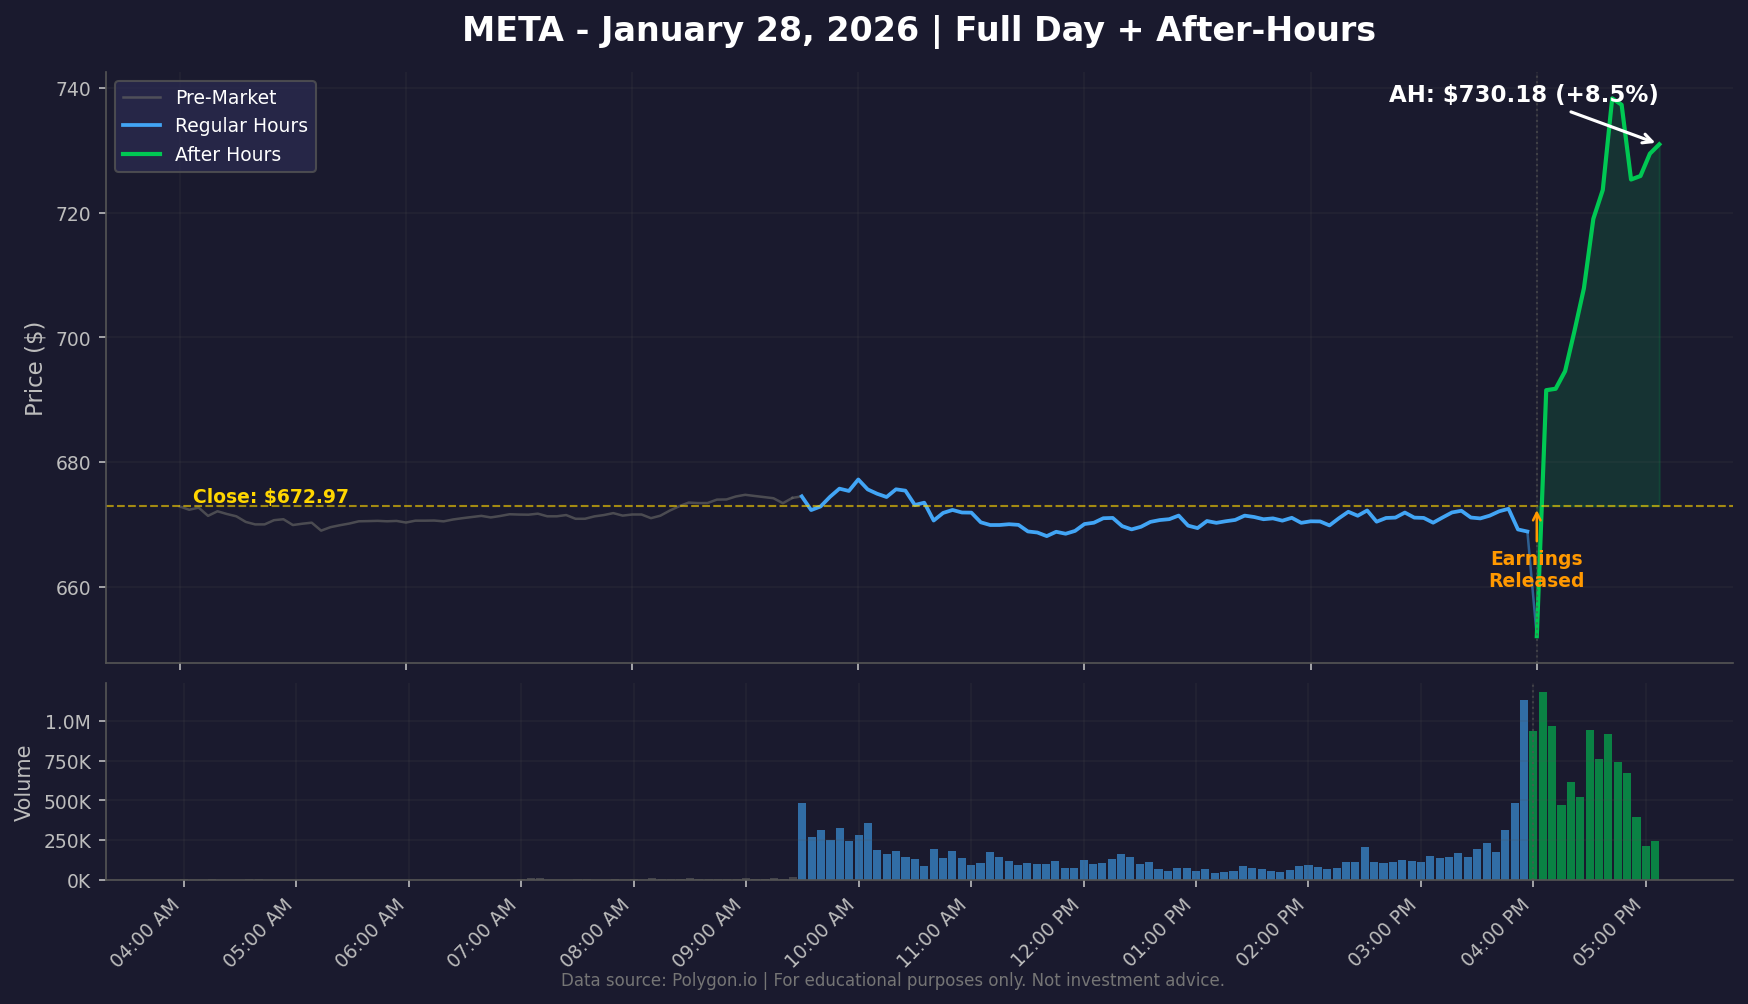
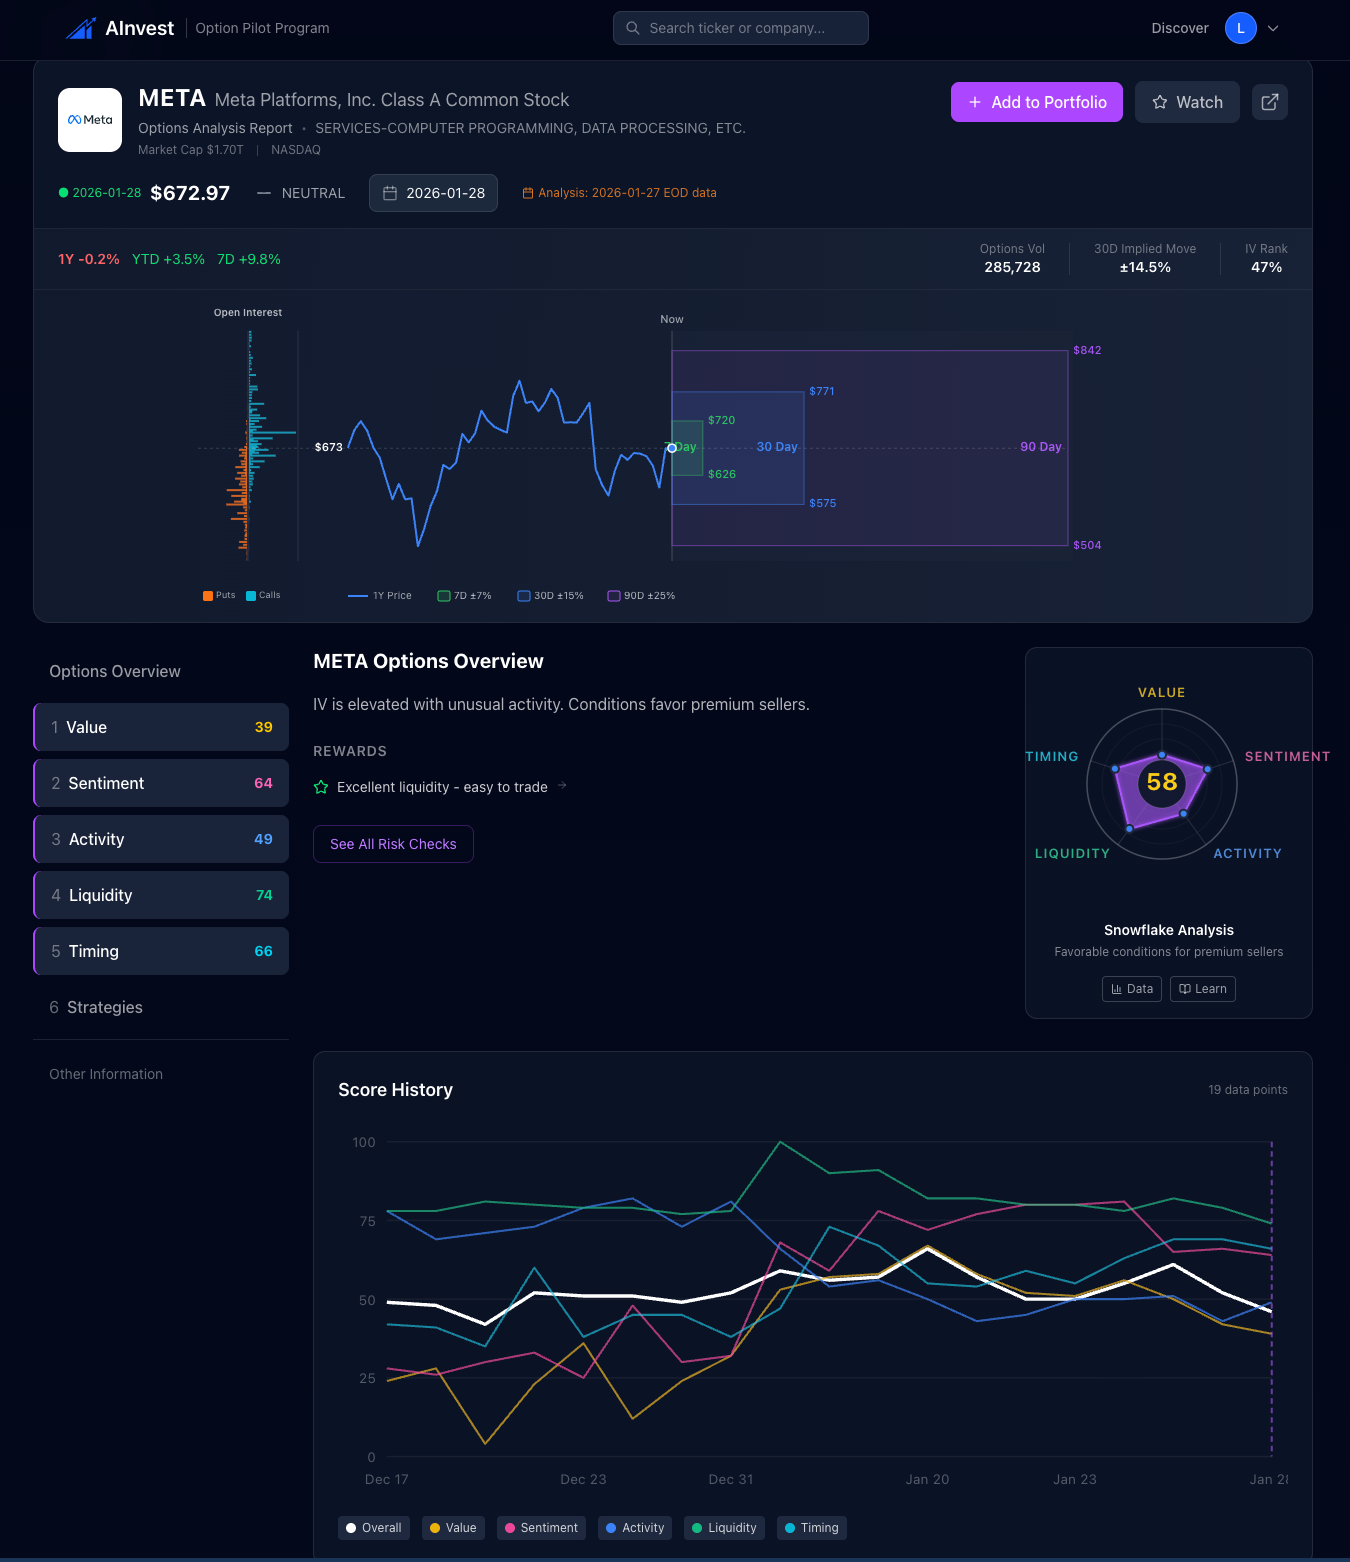
Pre-Earnings Scores: Value 46 | Sentiment 68 | Activity 58 | Liquidity 91 | Timing 47
The system's read: "IV is elevated with unusual activity. Conditions favor premium sellers."
META presented the most balanced scorecard of the four. The standout was Liquidity at 91, the highest score across all tickers. This means META's options had tight bid-ask spreads, deep open interest, and multiple liquid expirations. Whatever strategy you chose, execution would be efficient.
The Sentiment score of 68 leaned bullish. Options flow showed more call activity than put activity, with reasonable conviction quality. Traders were positioning for an upside move.
Activity at 58 was elevated but not extreme. There was above-average positioning, but it wasn't the kind of frenzy that signals something unusual.
What happened?
META surged +8.5% after hours, jumping from $672.97 to $730.18. It was the biggest mover of the night. However, by the next day's close, it had pulled back to $668.73, actually finishing below the previous close.
What the system surfaced
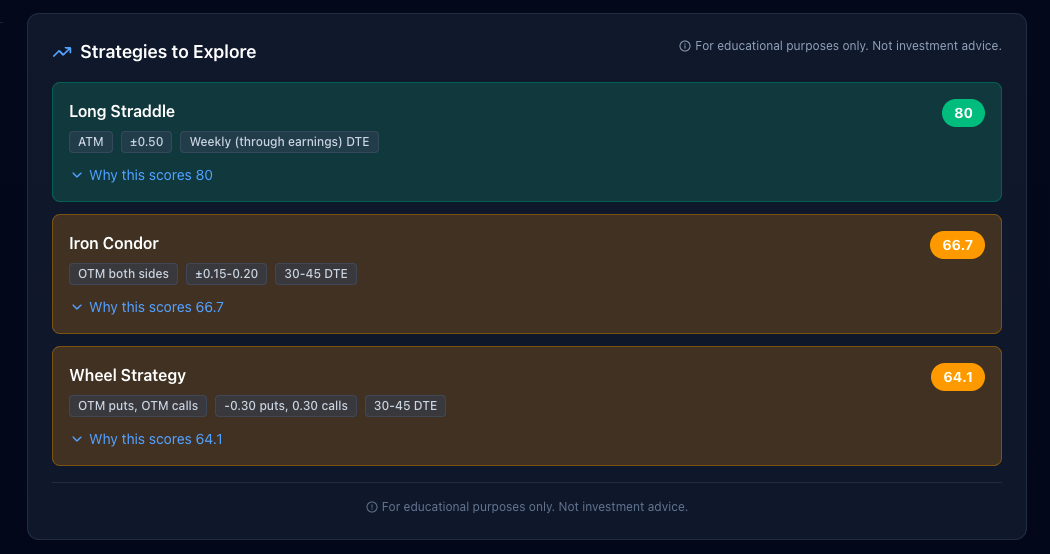
Again, Long Straddle topped the list (score: 80), followed by Iron Condor (66.7) and Wheel Strategy (64.1).
Key insight: The bullish Sentiment score (68) aligned with the initial after-hours reaction. But the full story played out over the next 24 hours. The AH surge of +8.5% followed by a next-day reversal to -0.6% is a textbook example of why earnings reactions are complex. The scoring system's focus on conditions rather than predictions keeps expectations realistic. The Liquidity score of 91 was the real differentiator: if you did trade META, you could do so efficiently.
MSFT: "No Clear Edge" Was The Most Honest Call
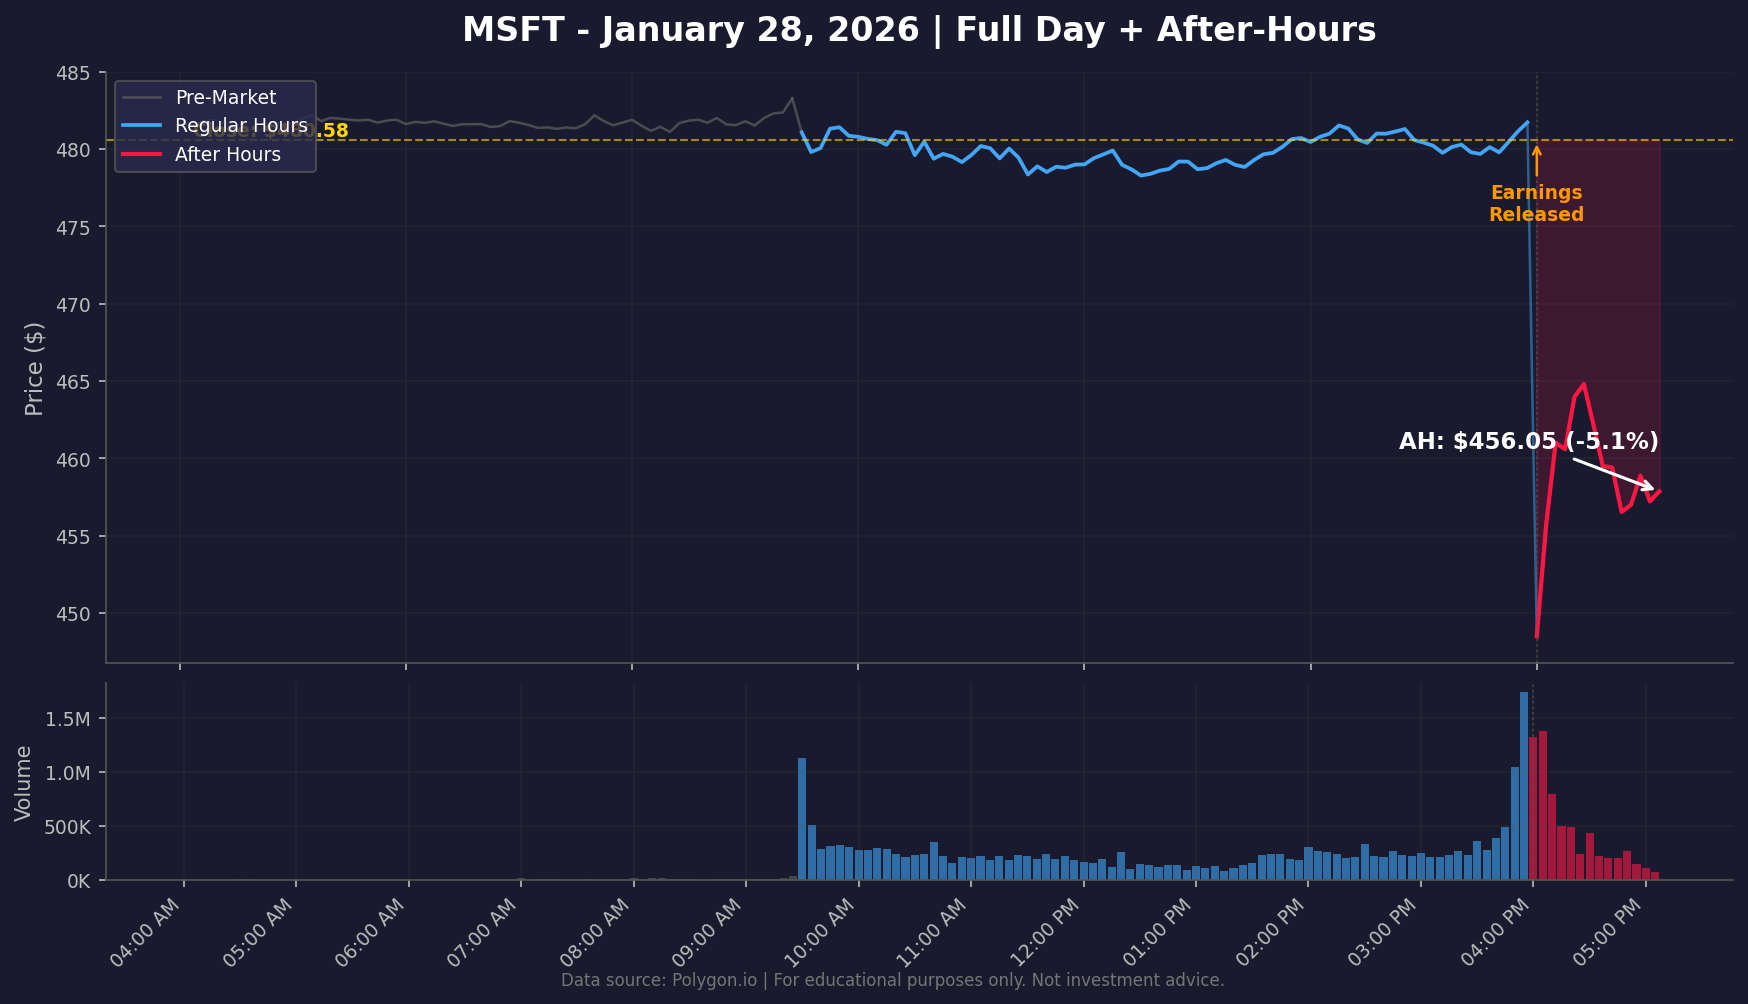
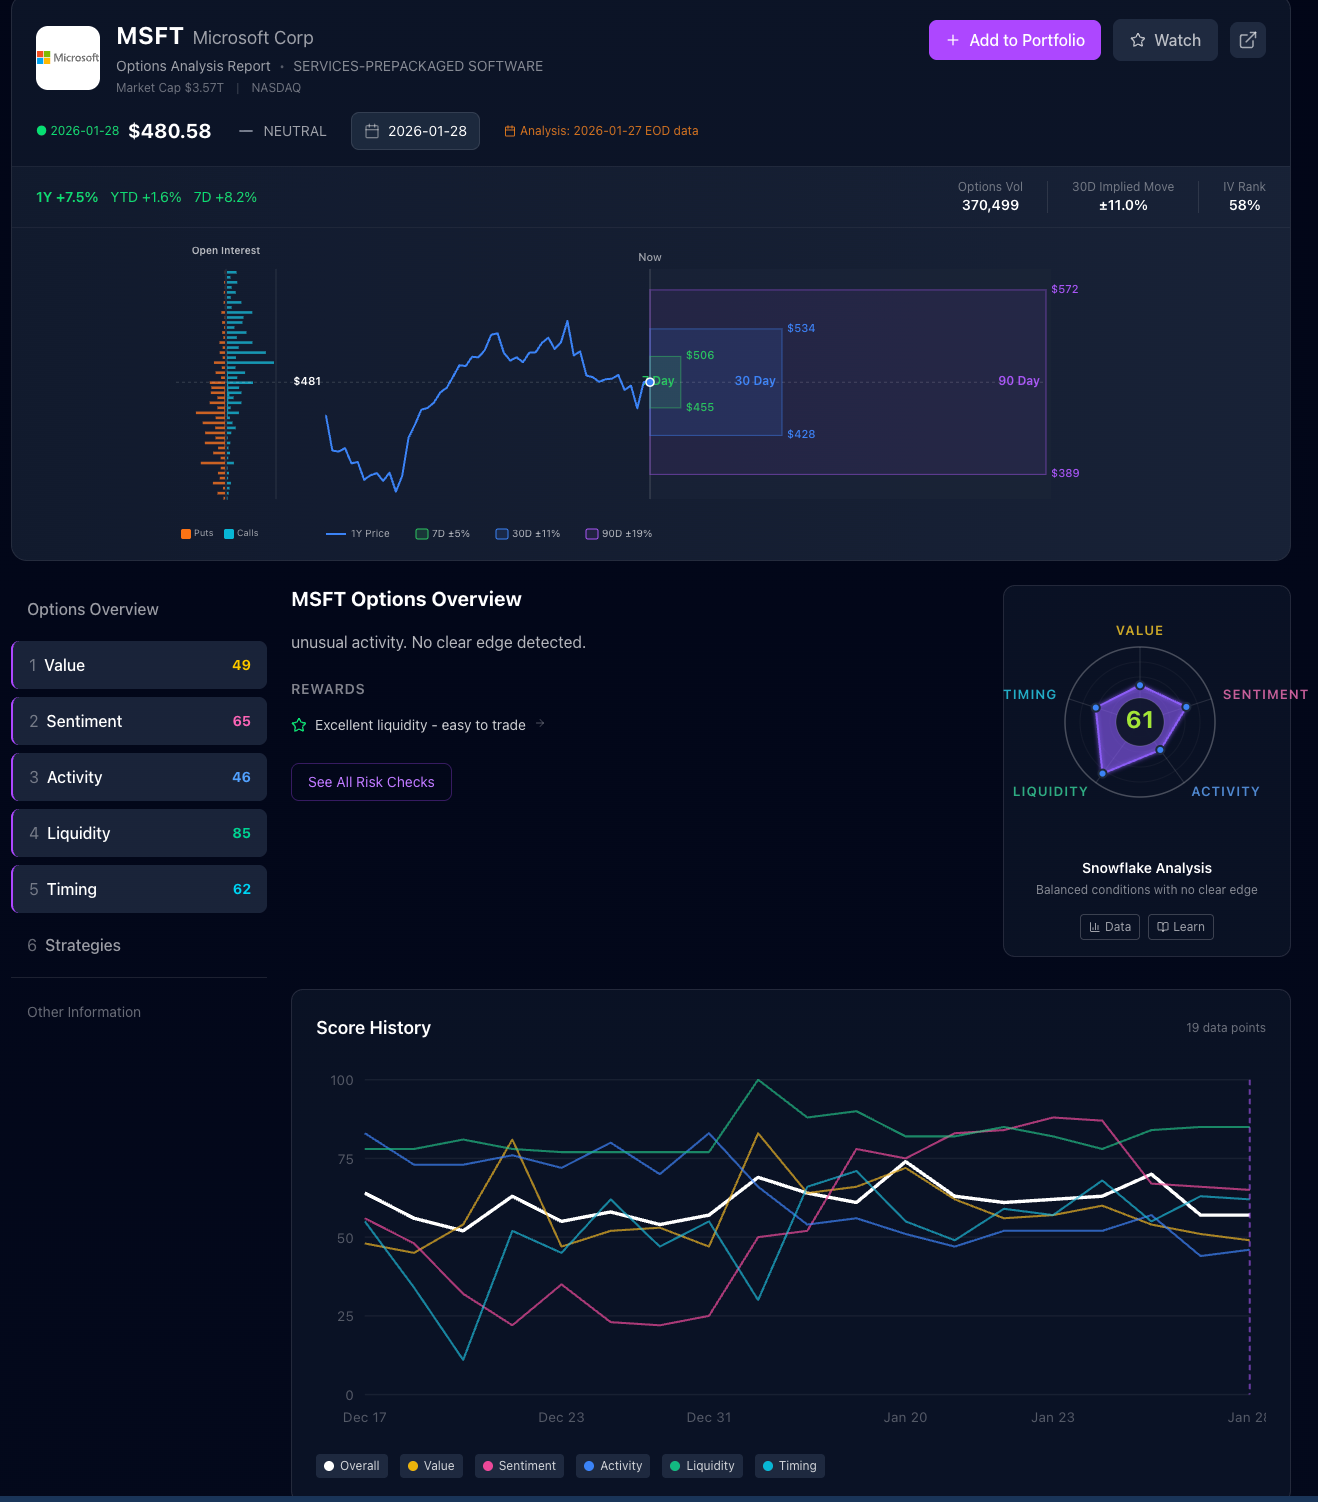
Pre-Earnings Scores: Value 49 | Sentiment 65 | Activity 46 | Liquidity 85 | Timing 62
The system's read: "Unusual activity. No clear edge detected."
MSFT had the most neutral scorecard of the group. Value at 49 meant IV was neither cheap nor expensive. Activity at 46 was normal. Timing at 62 was the highest timing score of all four tickers, which is notable: it suggests that even with earnings imminent, other timing factors were more favorable for MSFT.
The Liquidity score of 85 confirmed that MSFT is one of the most liquid options markets. Excellent execution quality.
But the overall assessment was clear: no clear edge. The scoring system didn't see strong conditions favoring any particular approach.
What happened?
MSFT dropped -5.1% after hours, falling from $480.58 to $456.05. But by the next day's close, it had recovered to $481.63, finishing essentially flat.
What the system surfaced
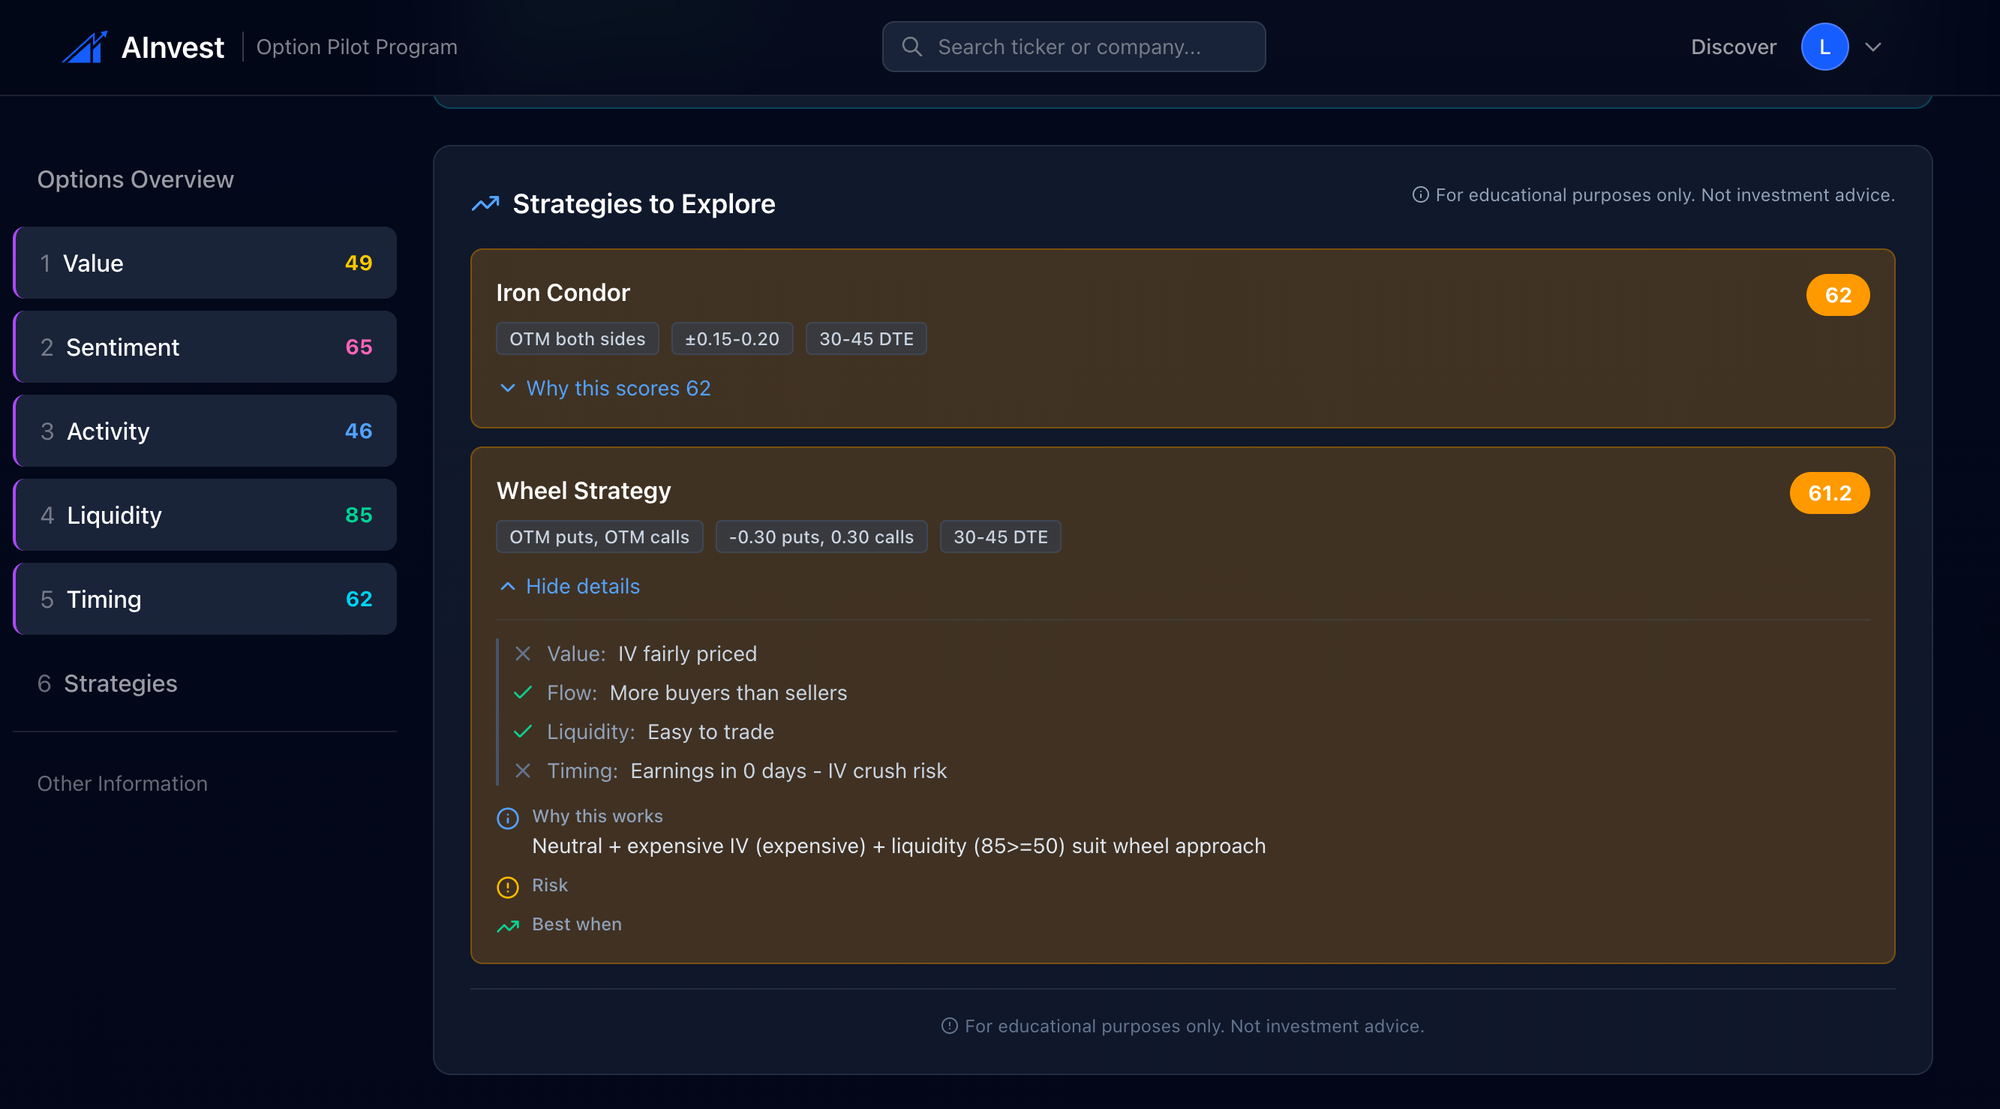
The strategy panel showed Iron Condor bias (score: 62) and Wheel Strategy bias (61.2). These are both conservative, premium-selling strategies. The expanded Wheel Strategy detail showed the system's reasoning:
- Value: IV fairly priced (neutral)
- Flow: More buyers than sellers
- Liquidity: Easy to trade
- Timing: Earnings in 0 days = IV crush risk
The system noted: "Neutral + expensive IV + liquidity (85>=50) suit wheel approach."
Key insight: "No clear edge" is one of the most valuable signals the system can give. Knowing when NOT to trade is an edge. MSFT's -5.1% after-hours drop would have hurt directional buyers, but the full reversal by next day's close means the Iron Condor bias (profit from range-bound outcome) was actually the right instinct. The stock ultimately went nowhere.
TSLA: Highest Activity Score Signals Unusual Positioning
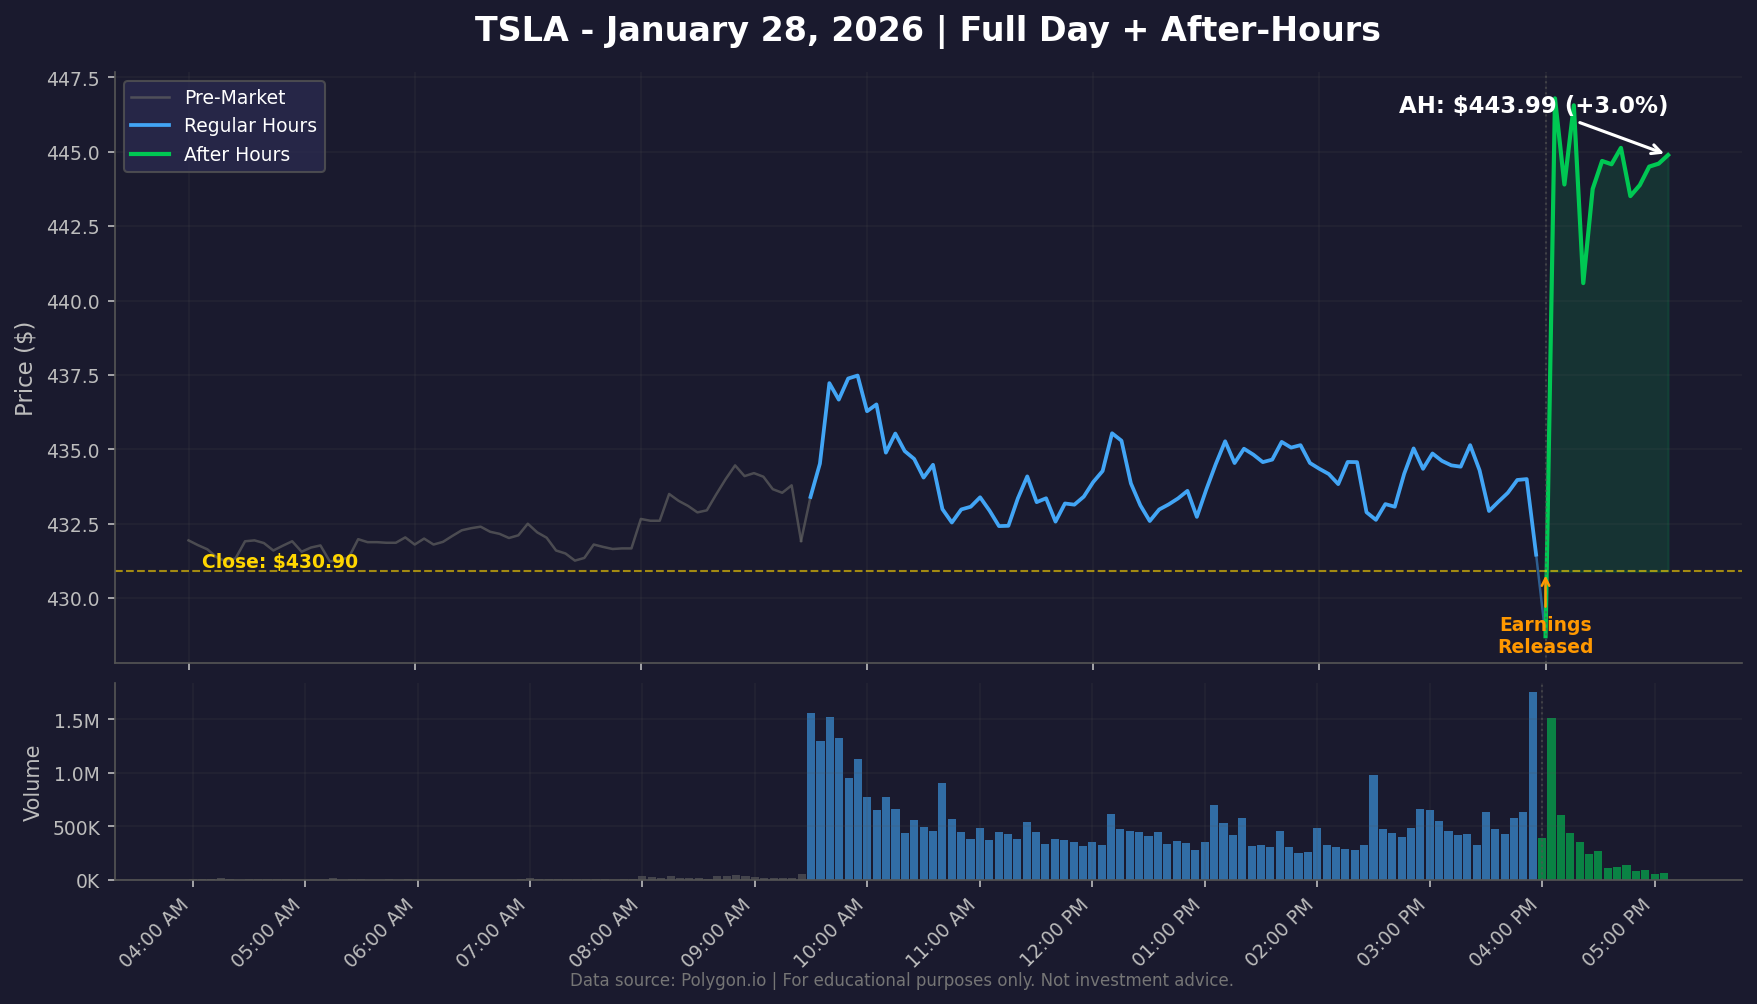
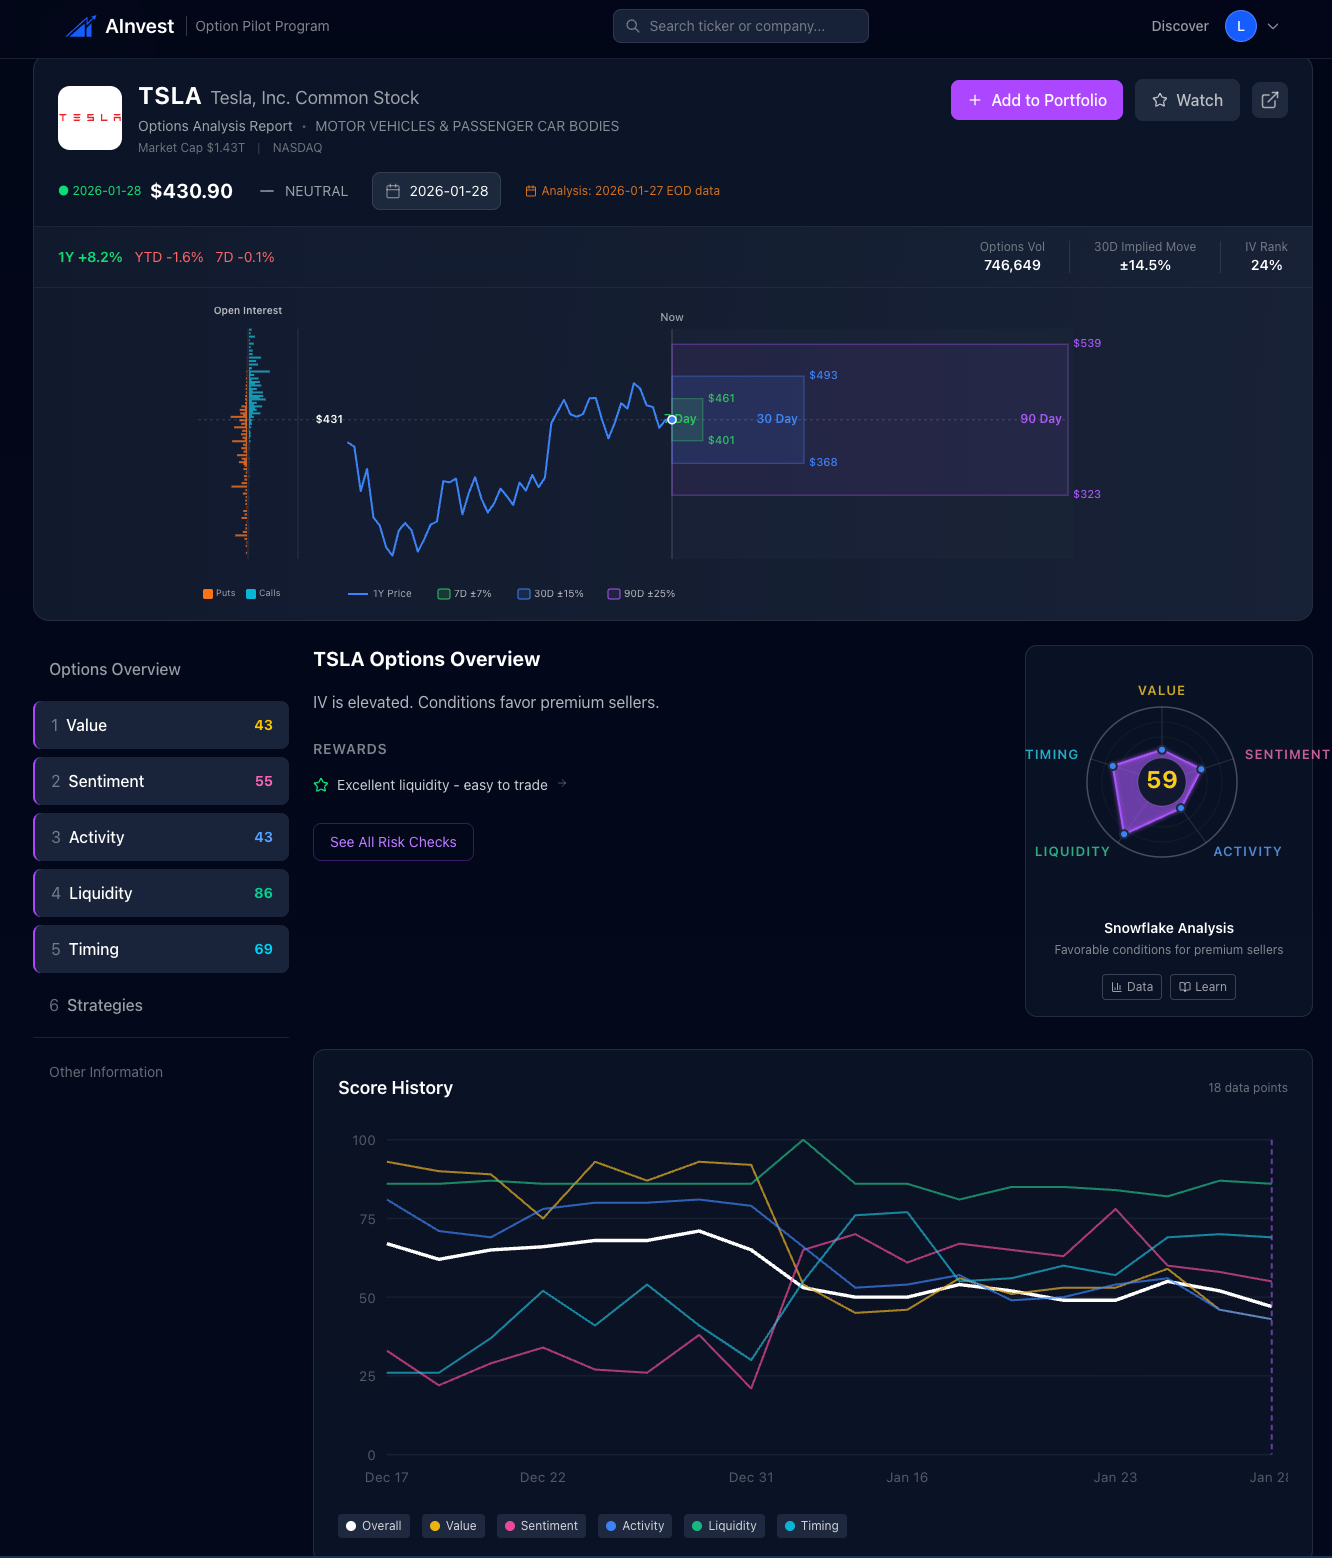
Pre-Earnings Scores: Value 69 | Sentiment 65 | Activity 89 | Liquidity 81 | Timing 24
The system's read: "IV is elevated. Conditions favor premium sellers."
TSLA's scorecard was the most dramatic. The Activity score of 89 was by far the highest of any ticker that night. This signals serious unusual options activity: elevated volume, concentrated strike bets, and multi-day persistence. Something was happening in TSLA options that the market was paying attention to.
The Value score of 69 confirmed that IV was elevated, meaning options were expensive relative to TSLA's own history. Combined with the seller-favorable lean, this indicated that premium was rich.
The Timing score of 24 was a clear warning flag. Earnings were imminent. Maximum event risk. Any strategy needed to account for the possibility of a large gap.
Liquidity at 81 was strong. TSLA is one of the most actively traded options names in the market. Execution would not be an issue.
What happened?
TSLA moved +3.0% after hours, rising from $430.90 to $443.99. By the next day's close, it had settled back to $431.46, essentially flat.
What the system surfaced
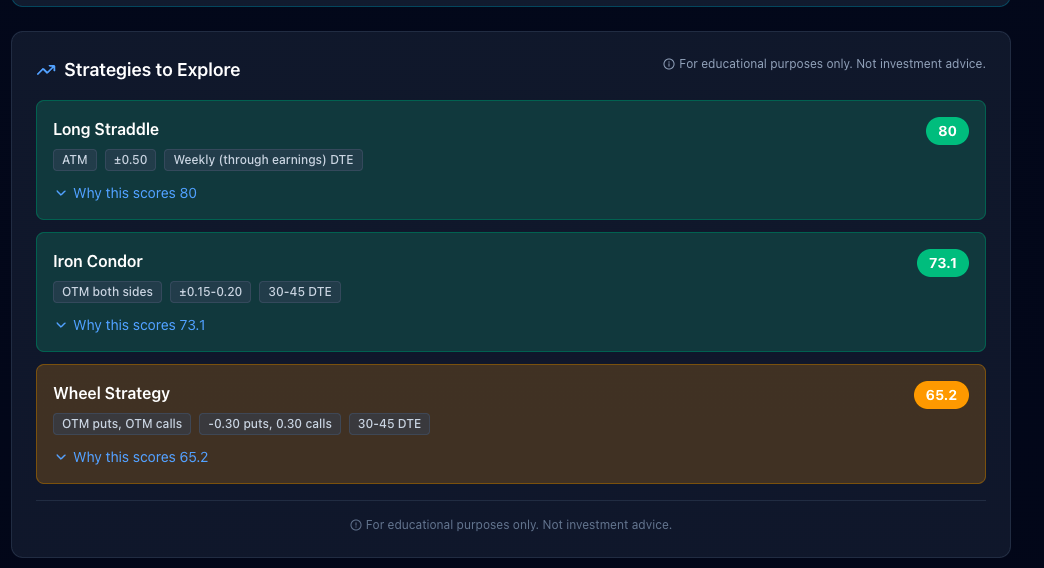
Long Straddle (score: 80) topped the list again, followed by Wheel Strategy (53.3).
Key insight: The Activity score of 89 was the most important signal. It told you that institutional and professional traders were actively positioning in TSLA options before earnings. While the +3.0% after-hours move was relatively modest for TSLA (which can move 10%+ on earnings), the high Activity score correctly flagged that the options market was anticipating a notable event. The next-day reversal to flat also validates the system's IV-elevated read: premium sellers who sold before earnings and bought back after the IV crush would have captured that edge.
Strategy Scoring: Why Long Straddle Dominated
Across all four tickers, the Long Straddle consistently scored 80 as the top strategy bias. Here's why that makes sense during earnings:
A Long Straddle involves buying both a call and a put at the same strike price. It profits from a large move in either direction. During earnings season, this strategy scores well because:
- IV is elevated (captured by the Value pillar) = volatility is expected
- Direction is uncertain (no single overwhelming Sentiment signal)
- The event is imminent (low Timing scores confirm earnings risk)
The system scores each strategy based on how well current conditions match that strategy's ideal setup. For earnings events, volatility strategies naturally score highest because the conditions are defined by uncertainty and expected large moves.
Important: Strategy scores are educational tools that show which approaches align with current market conditions. A score of 80 doesn't mean "this trade will make money." It means "current conditions favor this type of strategy." The distinction matters.
For traders who prefer defined risk, the Iron Condor appeared consistently (scores ranging 62-73). For income-oriented traders, the Wheel Strategy showed up across all four tickers (scores 53-65).
For educational purposes only. Not investment advice.
How Each Pillar Behaves During Earnings Season
Earnings season creates distinct patterns across all five pillars. Understanding these patterns helps you interpret the scores in context:
Value During Earnings
IV typically spikes in the weeks leading up to earnings as traders buy options for protection or speculation. This means the Value pillar often shows elevated IV (scores above 60-70), creating conditions that favor premium sellers. After earnings, IV collapses (the "IV crush"), which is why selling strategies can profit even if the stock moves against you.
In our case study: TSLA (69) and IBM (67) both showed elevated IV. META (46) and MSFT (49) were more neutral, suggesting the market wasn't pricing as much volatility into those names.
Sentiment During Earnings
Options flow before earnings reveals how traders are positioning. A high Sentiment score with bullish lean means call activity dominates. A bearish lean means put activity dominates. Neutral means the market is split.
In our case study: META's Sentiment of 68 (bullish lean) aligned with the initial +8.5% after-hours surge. All four had modestly bullish sentiment (51-68), but none showed extreme conviction. This is typical: institutional traders hedge both directions before earnings.
Activity During Earnings
This is arguably the most important pillar during earnings. A high Activity score tells you that the options market is paying attention. Low Activity (like IBM's 7) means the options market isn't positioned for a big move, which can sometimes mean the actual move catches everyone off guard.
In our case study: TSLA's 89 was the highest, indicating heavy institutional positioning. IBM's 7 was the lowest, yet IBM had the second-largest after-hours move (+7.9%). This contrast illustrates why Activity measures preparation, not prediction.
Liquidity During Earnings
Liquidity becomes critical during high-volatility events. Wide bid-ask spreads mean higher costs to enter and exit. During earnings, spreads can widen further as market makers increase their risk buffers.
In our case study: META (91) and MSFT (85) had excellent liquidity. IBM (31) was the weakest, meaning any IBM strategy would face higher execution costs. This is a real factor: a winning trade can be significantly less profitable if you're paying 5%+ to cross the spread.
Timing During Earnings
The Timing pillar is designed to flag imminent event risk. Before earnings, Timing scores drop because the system detects that a major catalyst is approaching. Low Timing scores don't mean "don't trade." They mean "be aware that event risk is maximum."
In our case study: IBM (8) and TSLA (24) had the lowest Timing scores, correctly flagging that earnings were imminent and event risk was at its peak. MSFT (62) had the highest, suggesting other timing factors were relatively more favorable.
Deep dive into any pillar: Value | Sentiment | Activity | Liquidity | Timing
Key Takeaways
1. The scoring system doesn't predict earnings outcomes. It assesses conditions. All four stocks moved significantly after hours, but the system's value was in showing where the edge was, not which direction the stock would go.
2. "No clear edge" is a valuable signal. MSFT's neutral scorecard was the most honest call of the night. The stock dropped 5% after hours but was flat by the next day. Traders who heeded the "no clear edge" warning and stayed out avoided unnecessary stress.
3. Volatility strategies dominated for a reason. Long Straddle scored 80 across all four tickers because earnings conditions inherently favor volatility plays: IV is elevated, direction is uncertain, and large moves are expected.
4. Liquidity matters more than you think. META (91) and TSLA (81) offered efficient execution. IBM (31) did not. The same strategy can have very different real-world returns depending on what you pay in bid-ask spreads.
5. After-hours reactions are not the final word. Every single ticker in this case study reversed or pulled back by the next day's close. META surged +8.5% AH but closed -0.6% the next day. MSFT dropped -5.1% AH but recovered fully. The scoring system's focus on conditions rather than direction helps maintain realistic expectations.
See It For Yourself
The AInvest Option Scoring System analyzes 4000+ optionable tickers across all five pillars, updated daily. Every score is transparent: you can see exactly which of the 30 sub-checks passed and which failed.
Whether it's earnings season or any other time, the scoring system gives you a visual, multi-dimensional read on options market conditions so you can make more informed decisions.
Join the waitlist to get early access:
https://optionpilot.ainvest.com/
Be among the first to navigate options with a framework built for clarity, not complexity.
For educational purposes only. Not investment advice. Past performance does not indicate future results. Options trading involves substantial risk and is not appropriate for all investors.