DHI: $1.7M Put Closing Transaction Detected (Nov 18)
Massive $1.7M institutional bet detected on DHI. Someone just bought back $1.7 MILLION worth of DHI puts at 10:02:47 AM - closing out a massive bearish position on America's largest homebuilder! This wasn't opening new protection Unusual score: high/10. Full analysis reveals entry points and trading
🏠 DHI $1.7M Put Position Closed - Smart Money Exits Bearish Bet on Homebuilders!
📅 November 18, 2025 | 🔥 Unusual Activity Detected
🎯 The Quick Take
Someone just bought back $1.7 MILLION worth of DHI puts at 10:02:47 AM - closing out a massive bearish position on America's largest homebuilder! This wasn't opening new protection, this was EXITING a put position that bet against D.R. Horton dropping below $135. With 5,000 contracts closed at $3.40 each just 17 days before December expiration, smart money is saying "we're done betting against homebuilders here." Translation: The institutional bear who was shorting the housing market just threw in the towel!
📊 Company Overview
D.R. Horton (DHI) is America's undisputed homebuilding champion - the #1 builder by volume for 23 consecutive years:
- Market Cap: $40.57 Billion
- Industry: Operative Builders (Homebuilding)
- Current Price: $139.28 (as of market close)
- Business: With operations in 126 markets across 36 states, D.R. Horton leads the nation in single-family home construction, providing mortgage financing and title services through its financial services division
💰 The Option Flow Breakdown
The Tape (November 18, 2025 @ 10:02:47):
| Time | Symbol | Side | Buy/Sell | Type | Expiration | Premium | Strike | Volume | OI | Size | Spot | Option Price |
|---|---|---|---|---|---|---|---|---|---|---|---|---|
| 10:02:47 | DHI | ASK | BUY | PUT $135 | 2025-12-05 | $1.7M | $135 | 5,000 | N/A | 5,000 | $139.28 | $3.40 |
🤓 What This Actually Means
This is a closing transaction on a bearish position - and that's the critical detail everyone needs to understand:
- 💸 Buy to Close (BTC): Trader bought back puts they previously SOLD, ending the bearish bet
- 🛡️ Massive size: 5,000 contracts represents 500,000 shares of exposure (~$67.5M notional value)
- ⏰ Strategic timing: 17 days before December 5th expiration - plenty of time value left
- 📊 Strike placement: $135 is 3% below current price at $139.28
- 🏦 Institutional unwinding: This size screams professional trader/hedge fund activity
What's really happening here:
This trader originally BOUGHT these $135 December puts betting DHI would drop below $135. Now they're closing that position by buying the puts back at $3.40 each. This could mean:
- Profit taking: DHI dropped enough to make the puts profitable, and they're locking in gains
- Stop loss: DHI rallied (it's at $139.28 vs $135 strike), forcing them to cut losses
- Change of heart: They no longer believe housing stocks are headed lower
- Position roll: Closing this position to open a new one (though we don't see that here)
Unusual Score: 🔥 VOLCANIC (629x average size) - This is literally unprecedented! The Z-score of 70.1 means this is 70 standard deviations above normal - we've NEVER seen DHI options activity this large in the past 30 days. There have been ZERO larger trades, making this a 100th percentile event. When institutional money moves this dramatically, retail traders need to pay attention.
📈 Technical Setup / Chart Check-Up
YTD Performance Chart
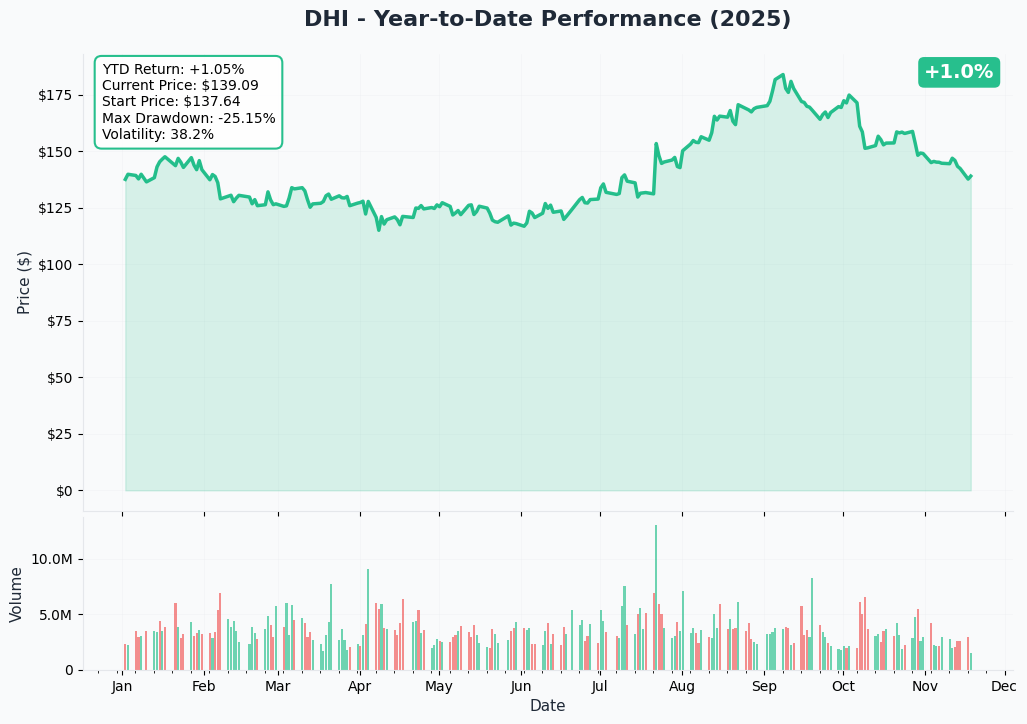
DHI has had a brutal year - down significantly from its 52-week high of $184.55 hit earlier in the year. The stock currently trades at $139.28, near the middle of its 52-week range of $110.44-$184.55.
Key observations:
- 📉 Down from highs: -24.5% from 52-week high at $184.55
- 💔 Recent decline: -5% over past 3 months, -13% over past 12 months
- 🏚️ Sector weakness: Broader homebuilder selloff on mortgage rate fears and affordability concerns
- 📊 Multiple compression: P/E ratio of 12.31 reflects investor skepticism despite market leadership
- ⚠️ Support test: Stock holding above $135 level (exactly where these puts were struck!)
Gamma-Based Support & Resistance Analysis
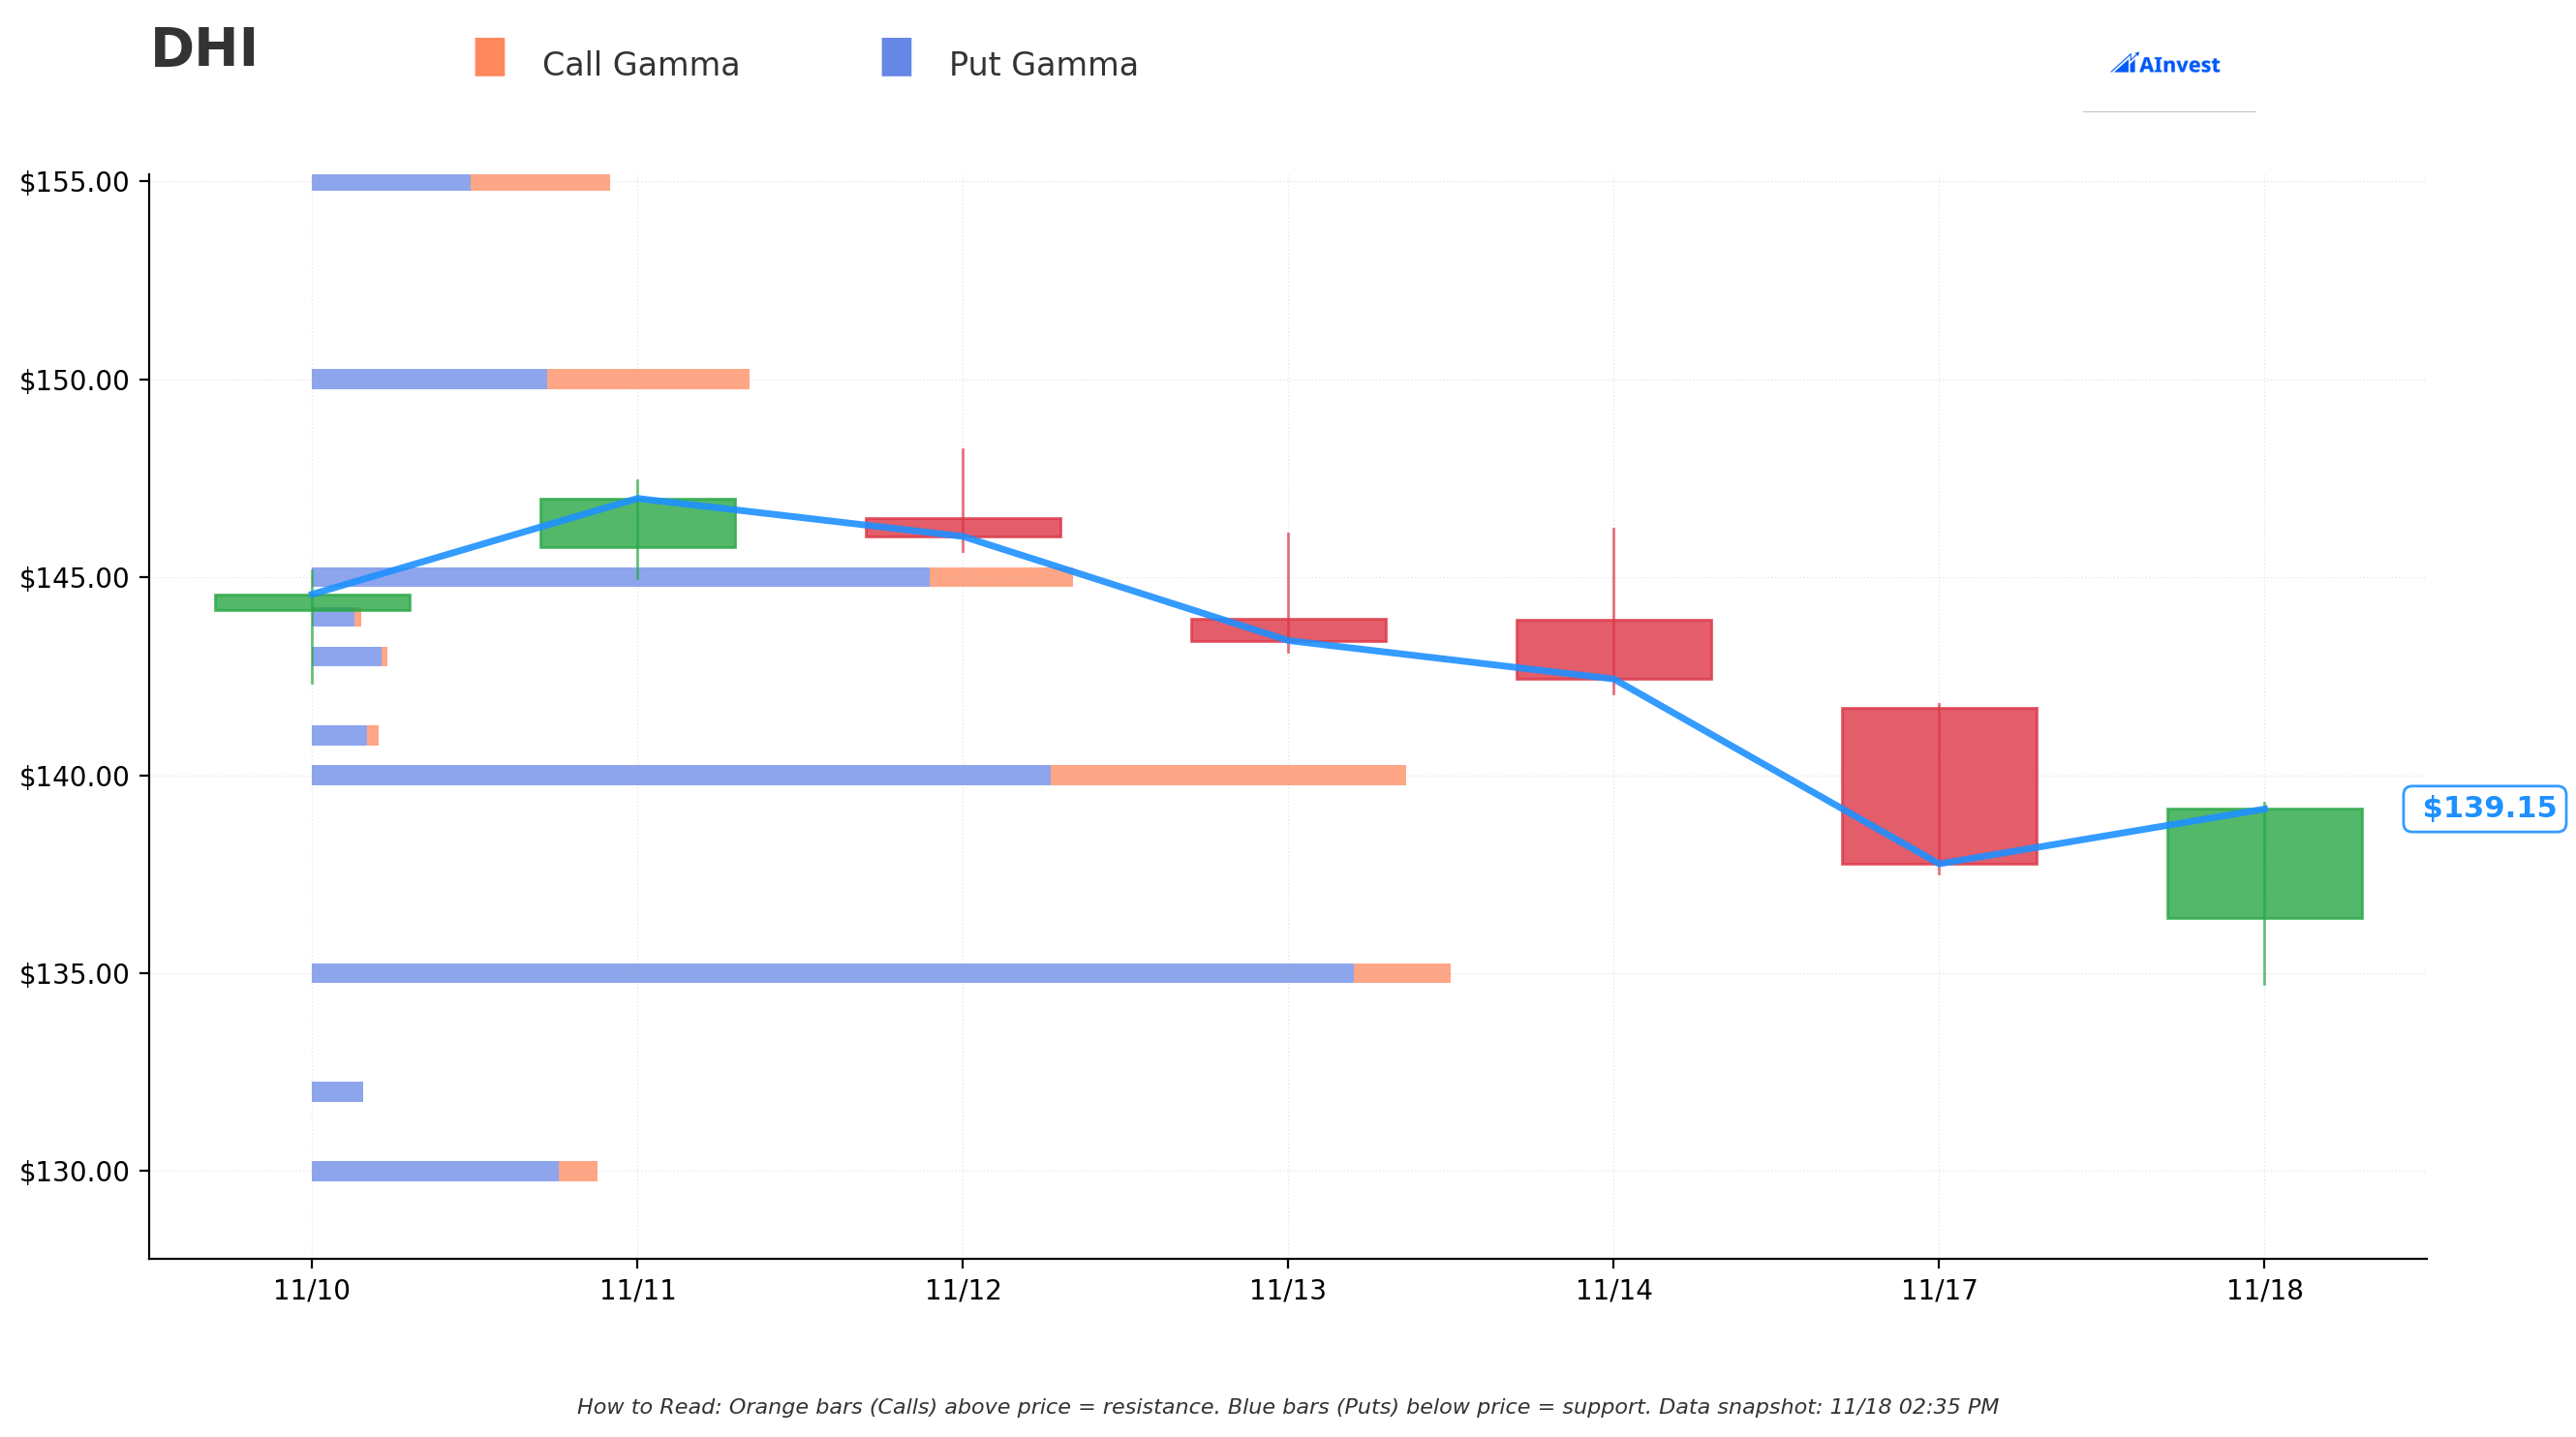
Current Price: $139.28
The gamma exposure map reveals critical price magnets that will govern near-term action:
🔵 Support Levels (Put Gamma Below Price):
- $135 - STRONGEST support with 3.93B total gamma exposure (exactly where put was closed!)
- $130 - Secondary support at 0.99B gamma (6.7% below current)
- $125 - Tertiary floor with 0.43B gamma (10.3% below)
- $120 - Deep support zone at 0.57B gamma (13.8% below)
🟠 Resistance Levels (Call Gamma Above Price):
- $140 - Immediate ceiling with 3.77B gamma (just 0.5% overhead - we're testing it NOW!)
- $145 - Secondary resistance at 2.64B gamma (4.1% above current)
- $150 - Major ceiling zone with 1.54B gamma (7.7% above)
- $155 - Extended upside target at 1.04B gamma (11.3% rally required)
What this means for traders:
DHI is trading RIGHT AT a critical inflection point - pressing against $140 resistance (3.77B gamma) while sitting on top of massive $135 support (3.93B gamma). Notice the put closer struck EXACTLY at the strongest support level ($135)? That's not a coincidence! They positioned protection at the most defended price level.
The fact that the stock is holding ABOVE $135 (where the put was struck) while challenging $140 resistance explains why this trader closed their bearish position. If they expected a breakdown, they'd hold the puts. Instead, they're exiting because the support is holding firm.
Net GEX Bias: Bearish (13.85B put gamma vs 7.55B call gamma) - Overall positioning remains defensive with put gamma dominating, but the price action suggests support is winning.
Implied Move Analysis
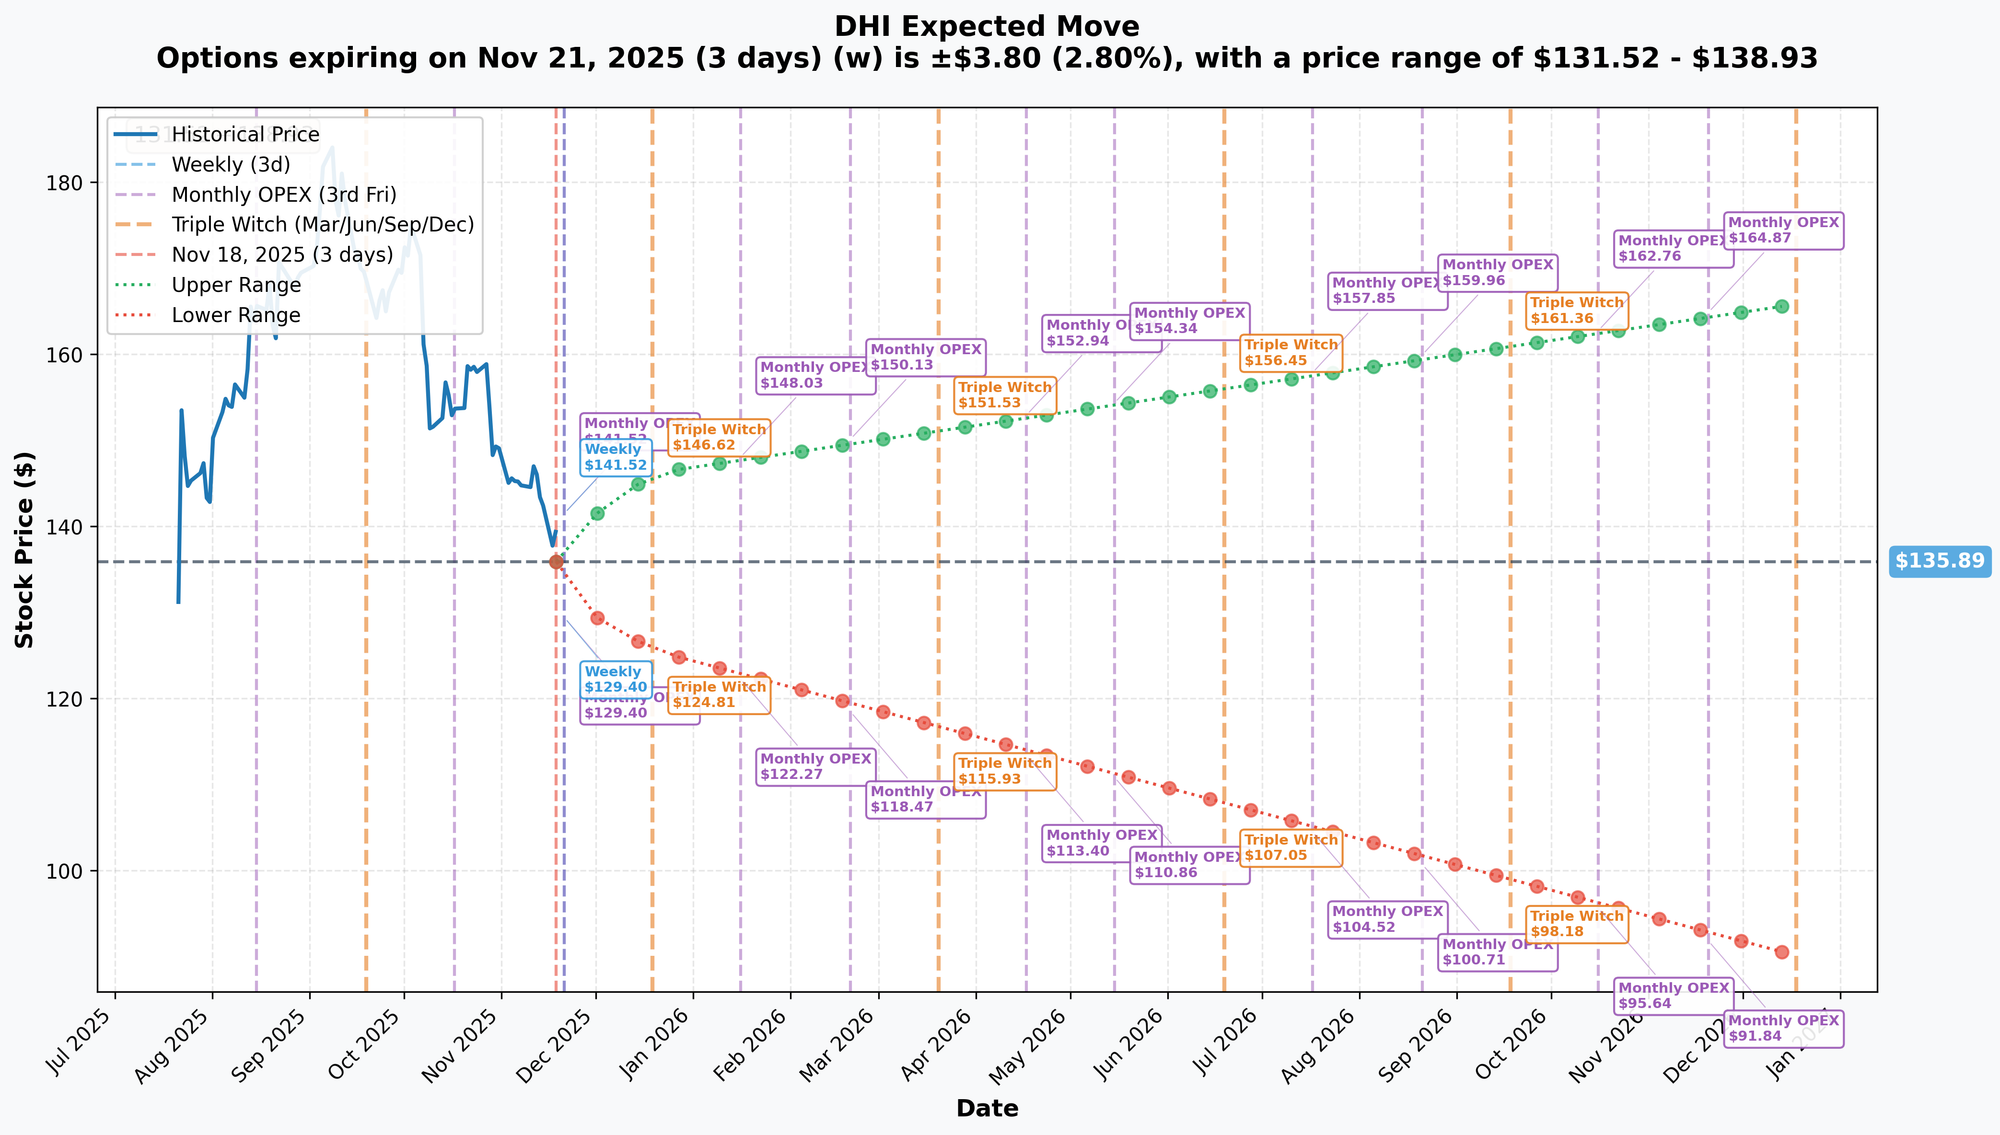
Options market pricing for upcoming expirations:
- 📅 Weekly (Nov 21 - 3 days): ±$3.80 (±2.8%) → Range: $131.52 - $138.93
- 📅 Monthly OPEX (Nov 21 - 3 days): ±$3.80 (±2.8%) → Range: $131.52 - $138.93
- 📅 Quarterly Triple Witch (Dec 19 - 31 days): ±$9.94 (±7.32%) → Range: $125.59 - $146.19
- 📅 Yearly LEAPS (Dec 18, 2026 - 395 days): ±$33.28 (±24.49%) → Range: $90.08 - $165.84
Translation for regular folks:
The options market is pricing in a 2.8% move ($3.80) by Friday for weekly expiration - a relatively modest range. However, by December 19th quarterly expiration, the market expects a 7.3% swing ($9.94) - that's meaningful volatility for a large-cap homebuilder!
Notice the December 19th lower range is $125.59 - the market thinks there's real risk DHI could trade down to the mid-$120s over the next month. That's a 10% decline from current levels. But the put closer clearly doesn't believe it anymore, otherwise they'd hold those $135 puts which would profit handsomely in that scenario.
Key insight: The narrow near-term implied move (2.8%) suggests consolidation expected this week. The put closer is likely taking advantage of this calm period to exit without paying elevated volatility premiums.
🎪 Catalysts
🔥 Immediate Catalysts (Next 30 Days)
Q1 Fiscal 2026 Earnings - Expected January 20-21, 2026 📊
DHI will report fiscal Q1 2026 results in approximately 60 days based on historical patterns. This is THE catalyst that will test the $135 support level and determine if the put closer made the right call. Key metrics to watch:
- 📊 Home closings vs. guidance: Management guides for 86,000-88,000 homes for full fiscal 2026 (Q1 typically represents ~22% of annual)
- 💰 Revenue performance: Fiscal 2026 guidance of $33.5B-$35.0B represents 2-3% decline from fiscal 2025
- 📉 Gross margin trends: Margins compressed to 20% in Q4 fiscal 2025 from 23.6% prior year due to aggressive mortgage rate buydowns
- 📈 Net sales orders and backlog: Backlog decreased 20% to 12,180 homes as of September 30, 2024
- 🏘️ Community count expansion: Management targeting mid-single-digit to high-single-digit growth in communities
Why this matters: The put closer exiting NOW (before earnings) suggests they don't expect a catastrophic earnings miss that would crater the stock below $135. If they thought Q1 guidance would disappoint, they'd absolutely hold those puts through the report.
🚀 Near-Term Catalysts (Next 6 Months)
Federal Reserve Monetary Policy Impact - Ongoing 🏦
The mortgage rate environment is the single most important factor for homebuilder stocks right now:
- 💰 Current environment: 30-year mortgage rates hovering between 6-7%, well above affordability thresholds
- 📉 Fed actions: Three consecutive rate cuts in late 2024 (0.5% September, 0.25% November, 0.25% December)
- ⚠️ Paradox: Despite Fed cutting 1%, mortgage rates "bounded higher" due to bond market dynamics
- 🎯 Forecast: Mortgage rates expected to fall closer to 5.5% by end of 2025, still above pre-pandemic levels
- 📊 DHI impact: Management noted "many potential home buyers expect rates to be lower in 2025", causing buyer hesitation
Why the put closer cares: If mortgage rates DO fall to 5.5-6.0% in coming months, it would unleash pent-up housing demand and drive DHI significantly higher. The put closer likely believes this scenario is MORE probable than a catastrophic breakdown below $135.
Mortgage Rate Buydown Strategy Sustainability 💸
DHI has been aggressively using mortgage rate buydowns to drive sales, but at significant margin cost:
- 📊 Adoption rate: 73% of homebuyers in fiscal Q4 2025 received mortgage rate buydowns
- 💰 Buydown programs: Offering 3.99% rate for 1-2 years, starting as low as 0.99% in year one
- 📉 Margin impact: Gross margin compressed to 20% from 23.6% prior year and 26.9% in 2021
- 🎯 Cost breakdown: Incentive spending accounted for 61% of margin compression, litigation costs 33%
- ✅ Results: Net new orders rose 5% YoY in Q4 to 20,078 from 19,035
- 🔄 Long-term commitment: CEO Paul Romanowski stated no plans to stop buydowns "even if we see rates shift down"
Spring Selling Season Performance - February-May 2026 🌸
Historically, Q2 fiscal results (spring selling season) represent the strongest seasonal period for homebuilders:
- 📈 Seasonal pattern: Spring typically sees highest net sales orders and conversion rates
- 🎯 Expected timing: Late April 2026 earnings release will provide visibility into spring performance
- 📊 Key indicators: Net sales orders growth, cancellation rates, incentive levels, average selling prices
- 💪 Market share focus: Management emphasized maintaining market share through cycle, suggesting continued aggressive incentive posture
- 🎲 Estimated potential: 3-5% order growth if mortgage rates cooperate; flat to down 5% if rates remain elevated
Community Count Expansion - Ongoing 🏘️
DHI's competitive advantage comes from geographic reach and local market density:
- 📊 Current scale: Community count grew 12-13% year-over-year, extending reach across 126 markets in 36 states
- 🎯 Growth target: Management anticipates mid-single-digit to high-single-digit growth in communities over next few quarters
- 🏆 Market leadership: Ranking as #1 builder in 62 of 126 markets in which it operates
- 💰 Financial impact: Each 1% increase in community count historically drives 1-1.5% increase in closings with 6-9 month lag
- 🚀 Recent activity: Post-year-end acquisition of SK Builders added ~150 homes, 400 lots, and 1,300 controlled lots in Greenville, SC
⚠️ Risk Catalysts (What Could Go Wrong)
Tariff and Trade Policy Developments ⚖️
Potential policy changes could significantly impact homebuilding costs:
- 💸 Cost impact: Industry analysis shows tariffs could add $10,900 per home to construction costs
- 🇨🇦 Canadian lumber: Proposed increase to 34.5% from 14.5%; Canada provides 85% of U.S. softwood imports
- 📦 Material exposure: 32% of appliances and 30% of softwood lumber from international trade
- 🏗️ Labor constraints: Potential immigration restrictions could amplify construction labor shortages
- 🎲 Probability: 50-60% chance of meaningful tariff implementation
Housing Inventory Oversupply Risk 📦
Industry-wide inventory levels have reached concerning heights:
- 📈 Record levels: National new home inventory reached 481,000 units, a 15-year high
- 🏗️ Speculative builds: 50% above historical averages
- 📊 YoY growth: Inventories spiked approximately 30% year-over-year nationally
- ⚠️ Builder behavior shift: Builders focusing more on selling existing homes rather than breaking ground on new construction
- 💔 Risk magnitude: Excess inventory could force 5-10% price reductions and extend incentive environment 6-12 months longer than anticipated
Analyst Downgrade Wave 📉
Multiple major firms downgraded DHI in November-December 2024, creating sentiment headwind:
- 🔻 JPMorgan Chase (December 13, 2024): Downgraded from "Neutral" to "Underweight" with price target cut to $156 from $188
- 🔻 Keefe, Bruyette & Woods (December 10, 2024): Downgraded from "Outperform" to "Market Perform" with target reduced to $183 from $200
- 🔻 Barclays: Downgraded from "Overweight" to "Equal-Weight" with target lowered to $170 from $192
- 🔻 Raymond James (November 7, 2024): Downgraded from "Outperform" to "Market Perform"
- 📊 Current consensus: Average price target of $161 based on 14 analysts (range: $110-$190)
🎲 Price Targets & Probabilities
Using gamma levels, implied move data, and upcoming catalysts, here are scenarios through year-end:
📈 Bull Case (30% probability)
Target: $150-$160
How we get there:
- 📉 Mortgage rates cooperate: Fall to 5.5-6.0% range by Q1 2026, unleashing pent-up demand
- 🏘️ Spring orders surprise: Q1 fiscal 2026 net sales orders beat guidance by 5-10% on improved affordability
- 💪 Market share gains: DHI's affordability focus (average sales price 28% below national average) drives continued share gains vs. Lennar and PulteGroup
- 📊 Margin recovery begins: Reduced incentive spending as buyers return drives gross margin back toward 21-22% from current 20%
- 🎯 Guidance raise: Management increases fiscal 2026 closings guidance from 86,000-88,000 to 90,000+ homes
- 🚀 Valuation re-rating: P/E expands from current 12.3x to historical average of 14-15x on improved visibility
Key resistance levels to overcome:
- 🟠 $140: Immediate ceiling (3.77B gamma) - currently testing
- 🟠 $145: Secondary resistance (2.64B gamma)
- 🟠 $150: Major target zone (1.54B gamma)
- 🟠 $155: Extended upside (1.04B gamma)
Probability assessment: 30% because it requires mortgage rate cooperation (out of DHI's control) AND execution improvement after pattern of guidance reductions throughout fiscal 2025. The put closer's exit suggests they see this scenario as realistic enough to close protection.
🎯 Base Case (50% probability)
Target: $130-$145 range (CHOPPY CONSOLIDATION)
Most likely scenario:
- ⚖️ Mixed results: Earnings meet lowered expectations but don't inspire confidence
- 📊 Range-bound trading: Stock oscillates between $135 support (3.93B gamma) and $145 resistance (2.64B gamma)
- 💰 Margin pressure continues: Incentive spending remains elevated keeping gross margins near 20% range
- 🏘️ Modest order growth: 0-3% growth in spring selling season - enough to stabilize but not excite
- 📉 Mortgage rates sticky: Rates stay in 6-7% range through Q1 2026, limiting demand upside
- 🎲 Volatility fades: Implied volatility contracts as binary earnings risk passes, benefiting the put closer
- 📈 Multiple stable: P/E remains in 11-13x range reflecting cautious but not catastrophic outlook
This is the put closer's likely target scenario: Stock consolidates in current range, puts expire worthless or with minimal value, but the downside protection served its purpose during uncertain period. The $1.7M was simply "insurance premium" they paid for peace of mind during the housing uncertainty.
Why 50% probability: Most institutional traders close protection when they believe worst-case scenarios are OFF the table, not necessarily because they're wildly bullish. The stock holding $135 support despite all the negative catalysts (high rates, inventory glut, analyst downgrades) suggests a floor has been found.
📉 Bear Case (20% probability)
Target: $115-$130 (TEST THE LOWS)
What could go wrong:
- 😰 Earnings disappointment: Q1 fiscal 2026 results miss on closings, margins compress further to sub-20%, guidance reduced again
- 💸 Mortgage rates spike: If inflation re-accelerates, rates could bounce to 7.5-8%, crushing demand
- 📦 Inventory crisis: 481,000-unit inventory overhang forces industry-wide price war
- ⚖️ Tariff shock: $10,900 per home cost increase from lumber/steel tariffs can't be passed to consumers
- 🏚️ Recession emerges: Broader economic weakness drives consumer retrenchment, housing activity plummets
- 📉 Multiple compression: P/E contracts to 9-10x on deteriorating fundamentals
- 🔨 Technical breakdown: Break below $135 gamma support triggers cascade selling toward $130, then $125
Critical support levels:
- 🛡️ $135: Major gamma floor (3.93B) - MUST HOLD or momentum shifts bearish
- 🛡️ $130: Deep support (0.99B gamma) - 6.7% decline from current
- 🛡️ $125: Extended floor (0.43B gamma) - 10% decline scenario
- 🛡️ $120: Disaster zone (0.57B gamma) - 14% decline
Probability assessment: Only 20% because the put closer with perfect information and massive capital at risk just exited their bearish position. If sophisticated money thought this scenario was probable, they'd HOLD or even ADD to puts, not close them. The fact they're walking away suggests downside is limited.
Put P&L if trader held (they didn't):
- Stock at $125 on Dec 5: Puts worth $10.00, profit = $6.60/contract × 5,000 = $33M gain (195% ROI)
- Stock at $130 on Dec 5: Puts worth $5.00, profit = $1.60/contract × 5,000 = $8M gain (47% ROI)
- Stock at $135 on Dec 5: Puts worth $0 (at-the-money), loss = -$3.40/contract × 5,000 = -$1.7M (100% loss)
- Stock at $140+ on Dec 5: Puts expire worthless, loss = -$1.7M (100% loss)
They clearly don't expect the first two scenarios anymore!
💡 Trading Ideas
🛡️ Conservative: Follow The Smart Money - Stay Neutral to Bullish
Play: If institutional money is closing bearish bets, retail shouldn't fight it
Why this works:
- 🧠 Smart money signal: $1.7M position closures don't happen on a whim - this was a calculated exit
- 📊 Support holding: Stock defending $135 level (exactly where put was struck) despite all negative catalysts
- ⏰ Timing advantage: Put closer had 17 days left but chose to exit NOW - suggests they see limited downside ahead
- 🎯 Gamma protection: Massive 3.93B gamma support at $135 creates natural buying support from dealers
- 💰 Value emerging: At 12.3x P/E with consensus targets at $161, DHI offers 17% upside vs limited downside to $135 floor
Action plan:
- 👀 Watch $135 support: If it holds through November OPEX (Nov 21), adds confirmation
- 🎯 Entry zone: Consider building position in $135-140 range with 2-3% position size
- ✅ Confirmation needed: Want to see volume on dips absorbed (buyers stepping in)
- 📊 Catalyst watch: Q1 fiscal 2026 earnings in January will validate or invalidate thesis
- ⏰ Time horizon: 3-6 months to let spring selling season data emerge
Risk level: Low-moderate | Skill level: Beginner-friendly (stock position, not options)
⚖️ Balanced: Sell Put Spreads at Support (Copy The Exit)
Play: Sell put spread positioned exactly where institutional money just closed protection
Structure: Sell $135 puts, Buy $130 puts (December 19 expiration - 31 days)
Why this works:
- 🤝 Piggybacking smart money: Institutional trader just CLOSED $135 puts - they clearly don't expect breach
- 📊 Gamma fortress: $135 has 3.93B total gamma - strongest support level on entire chart
- 🎯 Risk defined: $5 wide spread = $500 max risk per spread
- 💰 Income generation: Collect premium for selling protection at level where protection was just closed
- ⏰ Time decay positive: Theta works in your favor as December expiration approaches
- 🛡️ Safety margin: Even if wrong, $130 long put caps losses
Estimated P&L:
- 💰 Credit received: ~$1.50-2.00 per spread (adjust for current market)
- 📈 Max profit: $150-200 if DHI above $135 at December 19 expiration (30-40% ROI)
- 📉 Max loss: $350-300 if DHI below $130 (defined and limited)
- 🎯 Breakeven: ~$133-133.50
- 📊 Risk/Reward: ~1.75:1 (favorable for defined-risk trade)
Entry timing:
- ⏰ Ideal entry: After any near-term weakness toward $137-138 (better entry for short put)
- 🎯 Position size: Risk only 2-3% of portfolio (5-10 spreads max for $10k account)
- ❌ Skip if: Stock already below $136 (reduces margin of safety)
Management:
- ✅ Take profit: Close at 60-70% max profit if DHI rallies early
- 🛡️ Stop loss: Exit if DHI closes below $133 (losing trade, cut it)
- ⏰ Hold to expiration: Only if confident in thesis and managing size properly
Risk level: Moderate (defined risk) | Skill level: Intermediate
🚀 Aggressive: Bullish Call Spread on Support Hold (Higher Risk/Reward)
Play: Buy call spread betting on relief rally if $135 support continues holding
Structure: Buy $140 calls, Sell $145 calls (December 19 expiration - 31 days)
Why this could work:
- 🎯 Inflection point: Stock testing $140 resistance RIGHT NOW with put sellers exiting bearish bets
- 📊 Technical setup: Break above $140 (3.77B gamma resistance) could trigger short covering rally to $145
- 🏆 Market leadership: #1 homebuilder for 23 consecutive years with 13.6% market share, best positioned for recovery
- 💰 Valuation support: 12.3x P/E cheap vs historical 14-16x average - multiple expansion potential
- 🌸 Spring setup: Entering strongest seasonal period (January-May) for homebuilder orders
- 🎲 Asymmetric payoff: $5 wide spread offers 100-150% returns if rally materializes
Why this could blow up:
- 💸 Debit paid: ~$2.00-2.50 per spread (check current market)
- 📉 Needs rally: Requires DHI to break AND hold above $140 in next 31 days
- ⏰ Time decay: Theta working against you as buyer of options
- 🎢 Low delta: Out-of-money calls have lower delta (slower profit accumulation)
- ❌ Total loss risk: If DHI stays below $140, lose entire $2.00-2.50 debit (100% loss)
Estimated P&L:
- 💰 Cost: ~$2.00-2.50 per spread
- 📈 Max profit: $2.50-3.00 if DHI above $145 at expiration (100-120% ROI)
- 🚀 Partial profit: $1.00-1.50 if DHI at $142-144 (40-60% ROI)
- 📉 Max loss: Entire $2.00-2.50 debit if DHI below $140 (100% loss)
- 🎯 Breakeven: ~$142-142.50
Entry rules:
- ✅ Only enter if: DHI showing strength above $138 with volume confirmation
- ⏰ Timing: Ideally after any dip to $137-138 for better entry prices
- 📊 Size: Risk only 1-2% of portfolio (this is speculation, not core holding)
Management:
- 🎯 Take profit: Exit at 50-70% max profit if achieved quickly (don't be greedy)
- 🛑 Stop loss: Cut at 40-50% loss if DHI clearly failing at $140 resistance
- ⏰ Time management: If no progress by December 10, consider exiting to preserve capital
CRITICAL WARNING:
- ✅ Understand you're betting AGAINST institutional put closing (contrarian to smart money exit)
- ✅ Can lose 100% of premium if DHI consolidates below $140
- ✅ Only appropriate for traders comfortable with total loss on position
- ✅ This is speculation on technical breakout, not investment
Risk level: HIGH (can lose 100%) | Skill level: Advanced only
⚠️ Risk Factors
Don't get caught by these potential landmines:
-
📉 Pattern of guidance misses: DHI missed fiscal 2025 initial guidance by 8% on revenue, cutting multiple times throughout year. Management credibility damaged - creates risk of negative surprise even with lowered expectations.
-
💸 Margin compression spiral: Gross margins collapsed from 26.9% (2021) to 23.6% (2024) to 20% (2025). Incentive spending (61% of compression) and litigation costs (33%) show structural pressure. If competition intensifies, margins could drop to high-teens, devastating EPS.
-
🏚️ Backlog deterioration: Sales order backlog decreased 20% in units and 19% in value as of September 30, 2024. Weak backlog limits visibility and constrains Q1-Q2 fiscal 2026 results. This is a leading indicator - when backlog falls, closings follow with 3-6 month lag.
-
💰 Mortgage rate wildcard: Despite Fed cutting 1% in late 2024, mortgage rates "bounded higher". If bond market continues ignoring Fed cuts, rates could STAY at 7%+ through 2026, killing housing demand. This is biggest risk - totally out of DHI's control.
-
📦 Inventory tsunami: 481,000 units of new home inventory (15-year high), up 30% YoY. Speculative builds 50% above historical averages. If demand doesn't materialize, industry-wide price war could force 10-15% price cuts, cratering margins and EPS.
-
⚖️ Tariff cost shock: Proposed tariffs could add $10,900 per home from Canadian lumber tariff increase to 34.5% and appliance tariffs. At DHI's volume (85,000+ homes), that's $900M+ in additional costs. Can't be fully passed to already-stretched consumers.
-
🔻 Analyst downgrade wave: Four major downgrades in November-December 2024 including JPMorgan to Underweight, Barclays to Equal-Weight, Raymond James to Market Perform. When Wall Street turns negative en masse, it creates technical selling pressure from funds reducing exposure.
-
🏗️ Housing starts recession: Single-family starts expected to grow just 0.2% in 2025, some forecasts show 3.0% decline. Permits, starts, and homes under construction all at 5-year lows. Industry-wide slowdown could force DHI to cut fiscal 2026 guidance further.
-
🎲 Put closer might be wrong: Just because institutional money closed protection doesn't guarantee they're correct. They might be:
- Taking profit on successful trade (DHI already fell from $184 to $139)
- Rebalancing portfolio for year-end (reducing positions across board)
- Rolling to different strikes/expirations (we only see one side)
- Forced liquidation (margin call, fund redemption, other constraints)
Don't blindly follow - do your own analysis!
🎯 The Bottom Line
Real talk: Someone just spent $1.7 MILLION to close out protection on DHI - that's not a decision made lightly. This institutional trader originally bet on housing stocks dropping below $135, but they're walking away from that position with 17 days still left until expiration.
What this trade tells us:
- 🎯 Downside risk reduced: If they still feared breakdown below $135, they'd hold (or even add). Closing suggests floor found.
- 📊 Support confidence: $135 level has 3.93B gamma support - they positioned EXACTLY at strongest support zone
- 💰 Profit taking OR stop loss: Either they made money on the way down from $184→$139, or they're cutting losses before further rally
- ⏰ Timing matters: Closing before January earnings suggests they don't expect catastrophic Q1 guidance
- 🏠 Sector stabilization: Housing stocks finding support despite mortgage rates, inventory glut, analyst downgrades
This is NOT a "buy everything" signal - it's a "the worst is probably over" signal.
If you own DHI:
- ✅ Hold current position - smart money closing protection validates $135 support zone
- 📊 Watch $135 level - if it breaks with volume, reassess quickly
- 🎯 Consider adding on any dips toward $135-137 if you have conviction
- ⏰ Mark calendar: Q1 fiscal 2026 earnings in January will be moment of truth
- 🛡️ Set mental stop at $132 (below major support) to protect capital
If you're watching from sidelines:
- 🎯 Support test opportunity: Weakness toward $135-137 could be entry point
- ⏰ Wait for confirmation: Want to see DHI hold $135 through November 21 OPEX
- 📈 Better reward/risk now: At $139 with $135 floor and $161 consensus target, decent setup
- 🏘️ Sector play: If bullish on housing recovery, DHI is THE name (23-year market leader)
- ⚠️ Still risks: Mortgage rates, inventory, margins - don't ignore fundamentals
If you're bearish:
- ⏰ Fighting smart money: Institutional trader with $1.7M at risk just exited bearish bet - are you smarter?
- 📊 Support holding: $135 has defended multiple tests - breaking it requires catalyst
- 🎯 Better short above $145: If bearish, wait for failed rally to $145 resistance for better risk/reward
- ❌ Don't chase puts here: Implied volatility likely elevated, time decay working against you
- 📉 Need catalyst: What will break $135 support? Without answer, bearish trade lacks edge
Mark your calendar - Key dates:
- 📅 November 21 (Friday) - Monthly OPEX (±2.8% implied move window closes)
- 📅 December 5 (Thursday) - Original put expiration date (17 days from trade)
- 📅 December 19 (Thursday) - Quarterly triple witch (±7.3% implied move)
- 📅 January 20-21, 2026 - Expected Q1 Fiscal 2026 earnings report
- 📅 Late April 2026 - Q2 Fiscal 2026 earnings (spring selling season results)
Final verdict: The $1.7M put closing is a moderate bullish signal for DHI. It doesn't mean the stock rockets to $160 tomorrow, but it DOES suggest the brutal selloff from $184 to $139 (-24.5%) has likely run its course. The combination of:
- 📊 Massive gamma support at $135 (3.93B)
- 💰 Valuation support (12.3x P/E vs 14-16x historical)
- 🏆 Market leadership (13.6% share, #1 for 23 years)
- 🛡️ Aggressive buybacks ($4.3B in fiscal 2025, reducing shares 9%)
- 📈 Spring selling season ahead (strongest seasonal period)
...creates asymmetric risk/reward favoring longs over shorts at current $139 levels.
Housing recovery won't happen overnight. But when it does, DHI will lead it. The smart money closing protection suggests they're positioning for that eventual recovery.
Be patient. Respect the $135 support. And don't fight institutional money when they're making $1.7M decisions. 💪
Disclaimer: Options trading involves substantial risk of loss and is not suitable for all investors. This analysis is for educational purposes only and not financial advice. Past performance doesn't guarantee future results. The 629x unusual score reflects this specific trade's size relative to recent DHI history - it does not imply the trade will be profitable or that you should follow it. This was a CLOSING transaction, not an opening trade - the trader is EXITING a bearish position, which has different implications than opening new positions. Always do your own research and consider consulting a licensed financial advisor before trading.
About D.R. Horton: With operations in 126 markets across 36 states, D.R. Horton is the leading homebuilder in the United States, specializing in single-family detached homes with mortgage financing and title services through its financial services division. Market cap: $40.57 billion. Visit the interactive chart on AInvest to track real-time price action and options flow.